How to Monitor Nginx with Prometheus and Grafana? (Ste-by-Step - Install - Monitor - Fluentd)
- You can find the source code for this video in my GitHub Repo.
Intro
If you want to follow along, you need a Linux box. Preferably you would use Ubuntu 22.04 LTS as I do. You can use a virtual box to create it locally or maybe somewhere in the clouds.
You can also use my terraform code to create AWS VPC, an internet gateway, a single public subnet, routes, and an EC2 instance. You can find the source code in my github repository, which will cost you less than a dollar to run per day.
If you decide to use my code to SSH to the instance, you don't need SSH keys. Simply add this AmazonSSMManagedInstanceCore policy to your EC2 instance and use session manager to SSH.
| terraform/5-ec2.tf | |
|---|---|
Now let's initialize the terraform and apply. In a few minutes, you should have your EC2 instance.
It may take up to 5 minutes for the EC2 instance to show up in the Session Manager window.
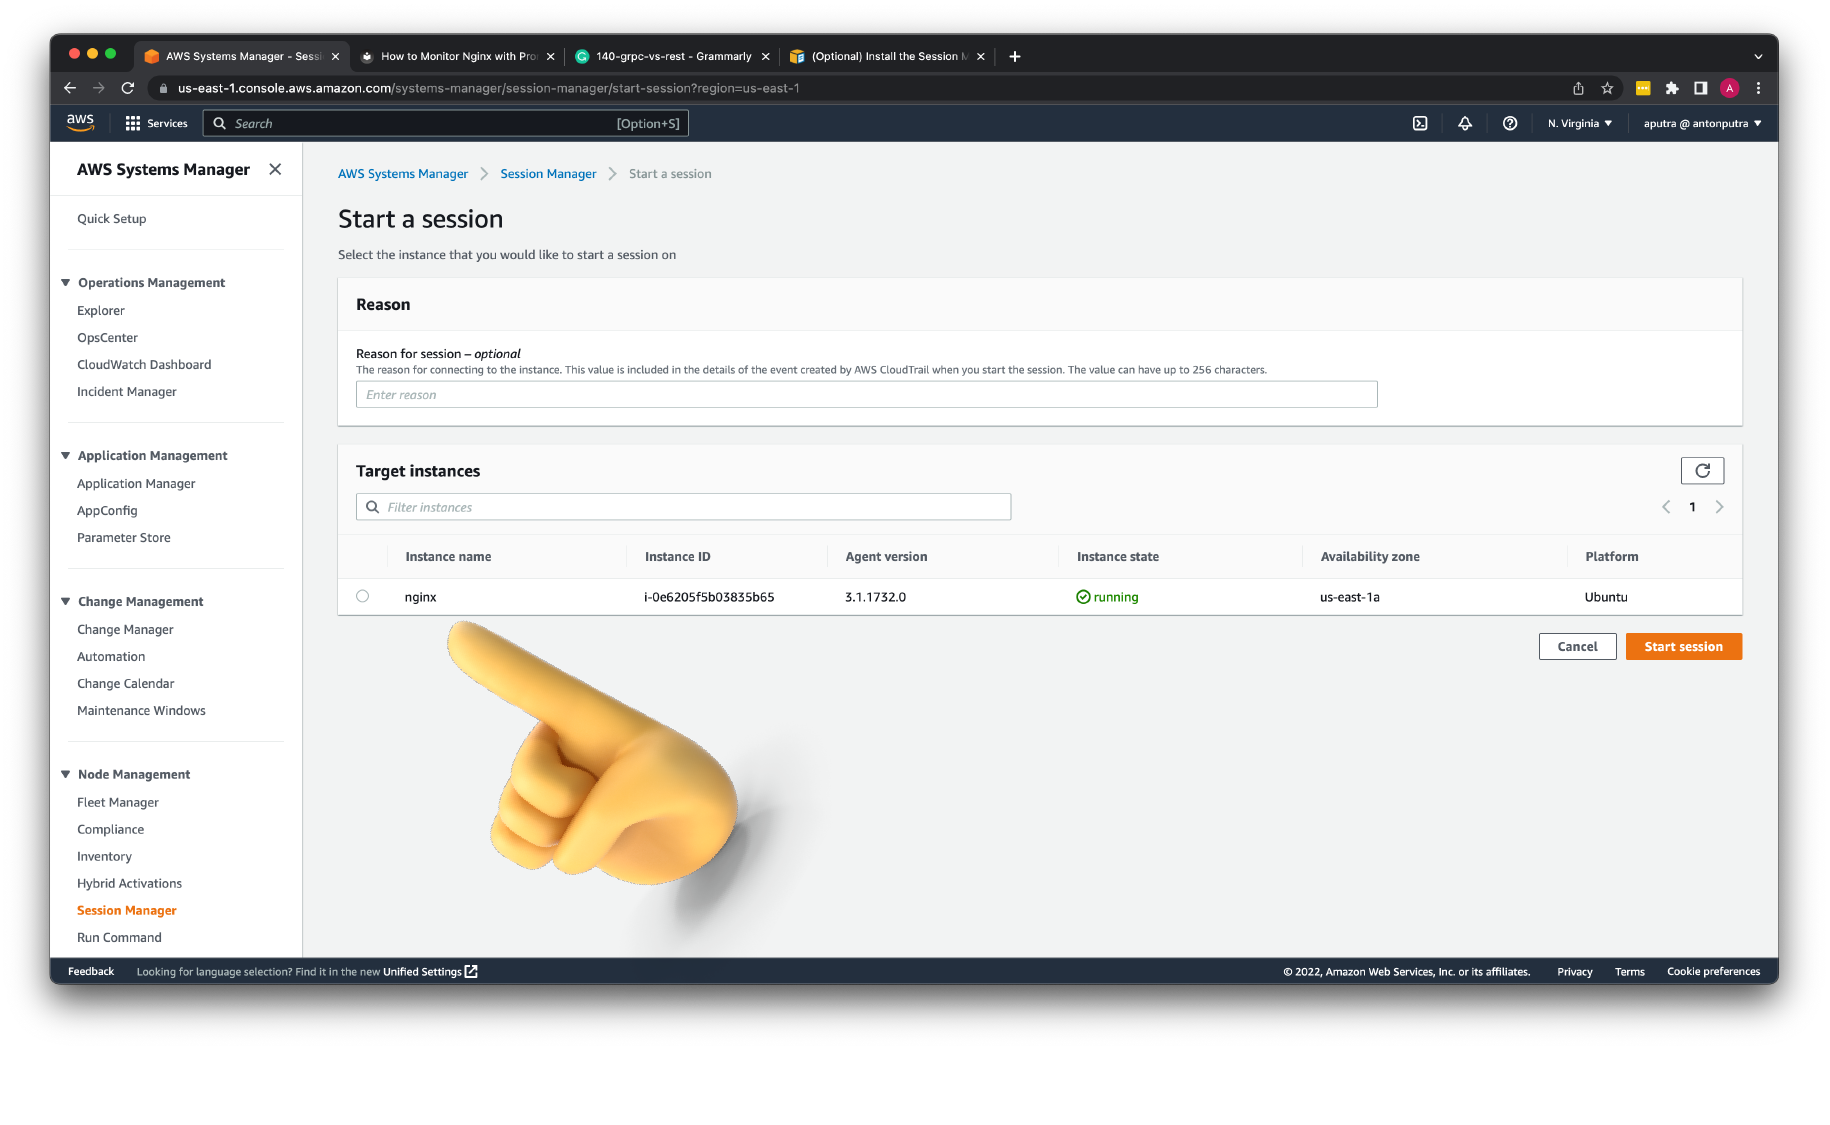 You can start a session from the AWS Console or I prefer to use cli command. To use cli, you would need to install the session manager plugin.
Install Nginx
To install the latest stable nginx version, we need to add an official nginx repository. First of all, before installing Nginx itself, we need to install some prerequisites.
Import an official nginx signing key so apt could verify the packages authenticity.
curl https://nginx.org/keys/nginx_signing.key | gpg --dearmor | sudo tee /usr/share/keyrings/nginx-archive-keyring.gpg >/dev/null
Verify that the downloaded file contains the proper key. If the fingerprint is different, remove the file.
gpg --dry-run --quiet --no-keyring --import --import-options import-show /usr/share/keyrings/nginx-archive-keyring.gpg
To set up the apt repository for stable nginx packages, run the following command:
echo "deb [signed-by=/usr/share/keyrings/nginx-archive-keyring.gpg] http://nginx.org/packages/ubuntu `lsb_release -cs` nginx" | sudo tee /etc/apt/sources.list.d/nginx.list
To install nginx, run the following commands:
Let's make sure that the basic metric module is configured with the nginx.
You should be able to find --with-http_stub_status_module in the output. If you don't have it, you need to compile Nginx with this module or use the dynamic modules.
Let's check if the Nginx is running.
In case it's not, let's start it.
Now it should be in a running state.
Let's use the Ubuntu IP address (http://<ip>/) to check if we can access Nginx.
Expose Basic Nginx Metrics
Let's create a new Nginx configuration file to add an additional server block with our metric module. If you used a different method to install Nginx, for example, default Ubuntu packages, you might have a different location for Nginx configurations.
Before creating a file, let me switch to the root Linux user. Later we will adjust Linux permissions and ownership.
Now the configuration file.
Optionally you can restrict this plugin to emit metrics to only the local host. It may be useful if you have a single Nginx instance and you install prometheus exporter on it as well. In case you have multiple Nginx servers, it's better to deploy the prometheus exporter on a separate instance and scrape all of them from a single exporter.
We'll use the location Nginx directive to expose basic metrics on port 8080 /status page.
| nginx/status.conf | |
|---|---|
Always verify if the configuration is valid before restarting Nginx.
To update the Nginx config without downtime, you can use reload command.
Now we can access http://<ip>:8080/status page.
Unfortunately, Open Source Nginx server only exposes these not-very useful metrics. I guess I would pay attention only to the active connections metric from here.
They decided to only provide meaningful metrics in the enterprise version of Nginx, which is called Nginx plus. I'll show you how to get around later in the tutorial.
Install Nginx Prometheus Exporter
Still, let's fetch all the available metrics for now. We'll use the Nginx prometheus exporter to do that. It's a Golang application that compiles to a single binary without external dependencies, which is very easy to install.
First of all, let's create a folder for the exporter and switch directory.
As a best practice, you should always create a dedicated user for each application that you want to run. Let's call it an nginx-exporter user and a group.
From the releases pages on GitHub, let's find the latest version and copy the link to the appropriate archive. In my case, it's a standard amd64 platform.
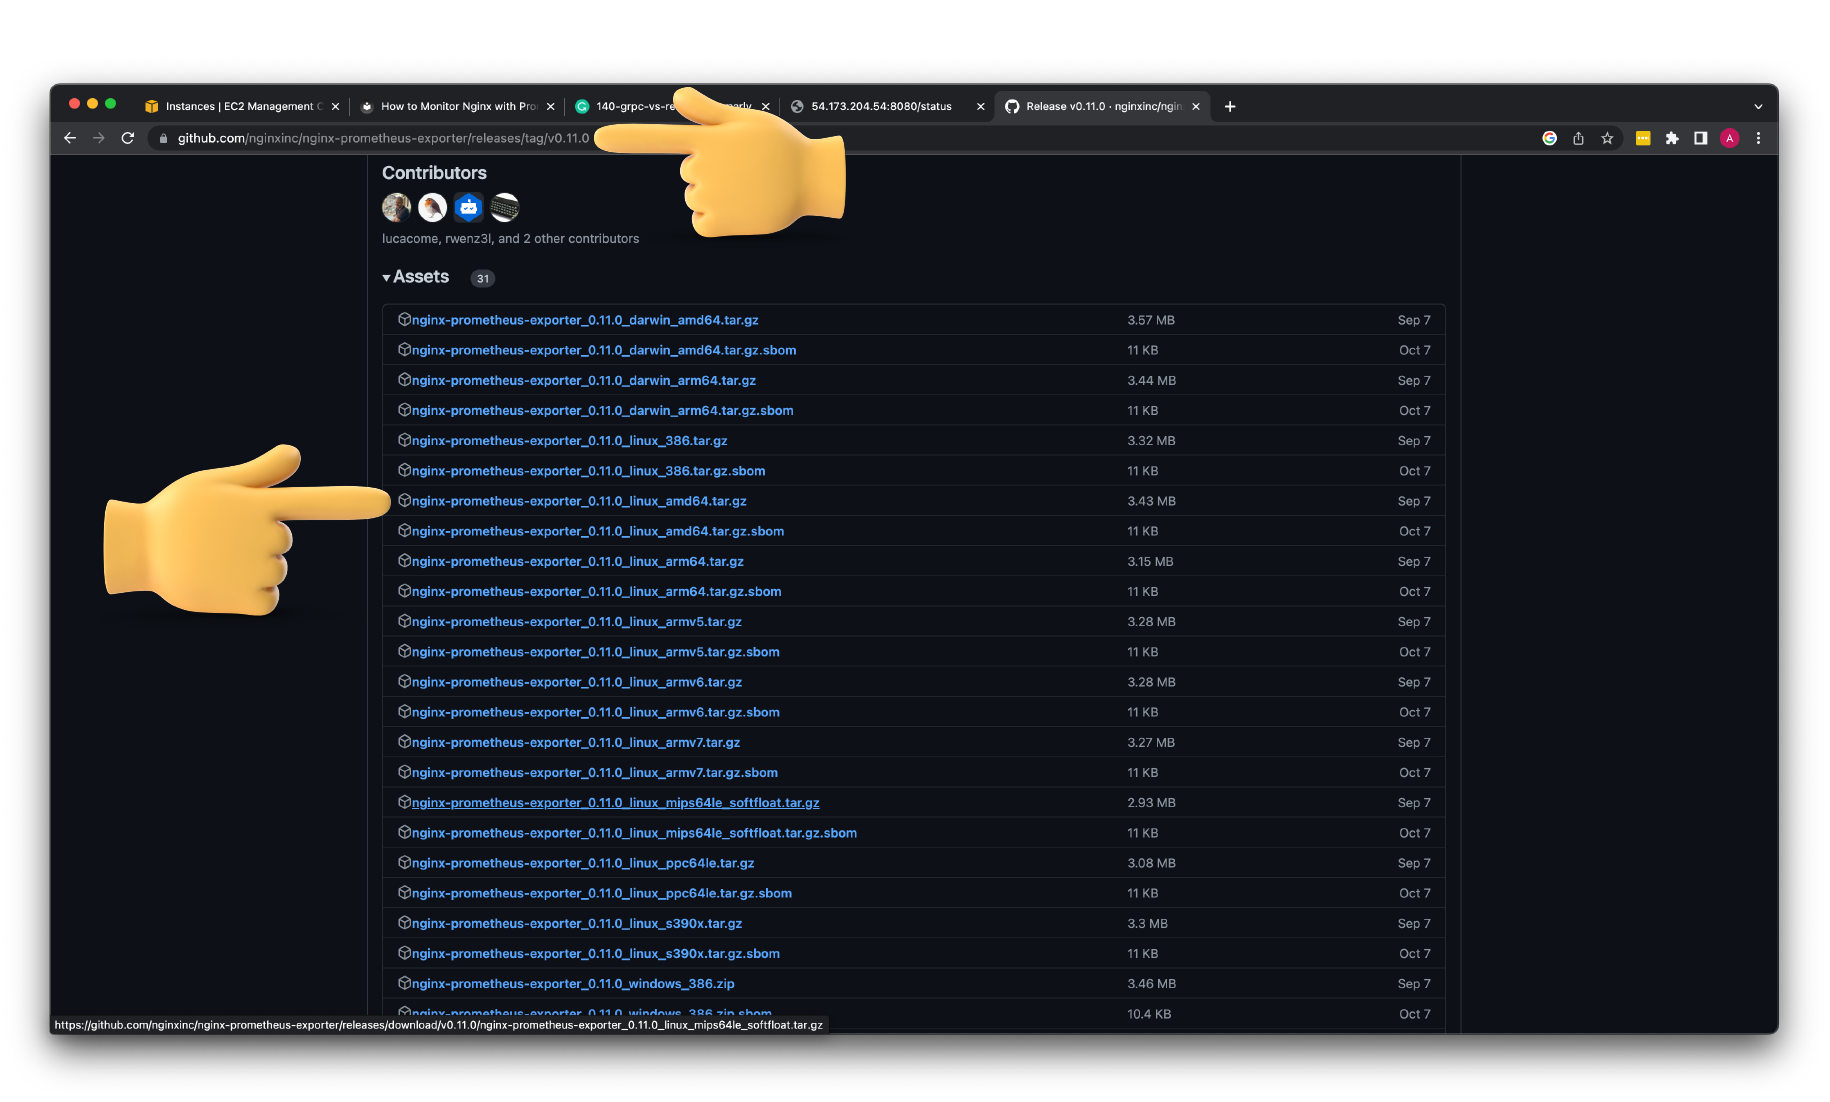
We can use curl to download the exporter on the Ubuntu machine.
curl -L https://github.com/nginxinc/nginx-prometheus-exporter/releases/download/v0.11.0/nginx-prometheus-exporter_0.11.0_linux_amd64.tar.gz -o nginx-prometheus-exporter_0.11.0_linux_amd64.tar.gz
Extract the prometheus exporter from the archive.
You can also remove it to save some space.
Let's make sure that we downloaded the correct binary by checking the version of the exporter.
It's optional; let's update the ownership on the exporter folder.
To run it, let's also create a systemd service file. In case it exits systemd manager can restart it. It's the standard way to run Linux daemons.
Make sure you update the scrape-uri to the one you used in Nginx to expose basic metrics. Also, update the Linux user and the group to match yours in case you used different names.
Enable the service to automatically start the daemon on Linux restart.
Then start the nginx prometheus exporter.
Check the status of the service.
If your exporter fails to start, you can check logs to find the error message.
To verify that Prometheus exporter can access nginx and properly scrape metrics, use curl command and default 9113 port for the exporter.
Now you should be able to get the same metrics from the status page but in Prometheus format.
# HELP nginx_connections_accepted Accepted client connections
# TYPE nginx_connections_accepted counter
nginx_connections_accepted 8
# HELP nginx_connections_active Active client connections
# TYPE nginx_connections_active gauge
nginx_connections_active 1
# HELP nginx_connections_handled Handled client connections
# TYPE nginx_connections_handled counter
nginx_connections_handled 8
# HELP nginx_connections_reading Connections where NGINX is reading the request header
# TYPE nginx_connections_reading gauge
nginx_connections_reading 0
# HELP nginx_connections_waiting Idle client connections
# TYPE nginx_connections_waiting gauge
nginx_connections_waiting 0
# HELP nginx_connections_writing Connections where NGINX is writing the response back to the client
# TYPE nginx_connections_writing gauge
nginx_connections_writing 1
# HELP nginx_http_requests_total Total http requests
# TYPE nginx_http_requests_total counter
nginx_http_requests_total 8
# HELP nginx_up Status of the last metric scrape
# TYPE nginx_up gauge
nginx_up 1
Install Prometheus
Now let's quickly install the latest version of prometheus on the same host.
Create a dedicated Linux user for Prometehus.
Let's check the latest version of Prometheus from the download page.
You can use the curl or wget command to download Prometheus.
curl -L https://github.com/prometheus/prometheus/releases/download/v2.41.0/prometheus-2.41.0.linux-amd64.tar.gz -o prometheus-2.41.0.linux-amd64.tar.gz
Then, we need to extract all Prometheus files from the archive.
Usually, you would have a disk mounted to the data directory. For this tutorial, I will simply create a /data director. Also, you need a folder for Prometheus configuration files.
Now, let's change the directory to Prometheus and move some files.
First of all, let's move the prometheus binary and a promtool to the /usr/local/bin/. promtool is used to check configuration files and Prometheus rules.
Optionally, we can move console libraries to the Prometheus configuration directory. Console templates allow for the creation of arbitrary consoles using the Go templating language. You don't need to worry about it if you're just getting started.
Finally, let's move the example of the main prometheus configuration file.
To avoid permission issues, you need to set correct ownership for the /etc/prometheus/ and /data directory.
Optionally you can clean up and delete the archive itself and unused files.
Verify that you can execute the Prometheus binary by running the following command:
We're going to use systemd, which is a system and service manager for Linux operating systems. For that, we need to create a systemd unit configuration file.
Make sure you're using the correct username and group. Also, check the data path.
Before we launch Prometheus, let's add our Nginx Prometheus Exporter as a target.
Update the job name to nginx-prometheus-exporter and port to 9113.
| /etc/prometheus/prometheus.yml | |
|---|---|
To automatically start the Prometheus after reboot, run enable.
Then just start the Prometheus.
To check the status of Prometheus run following command:
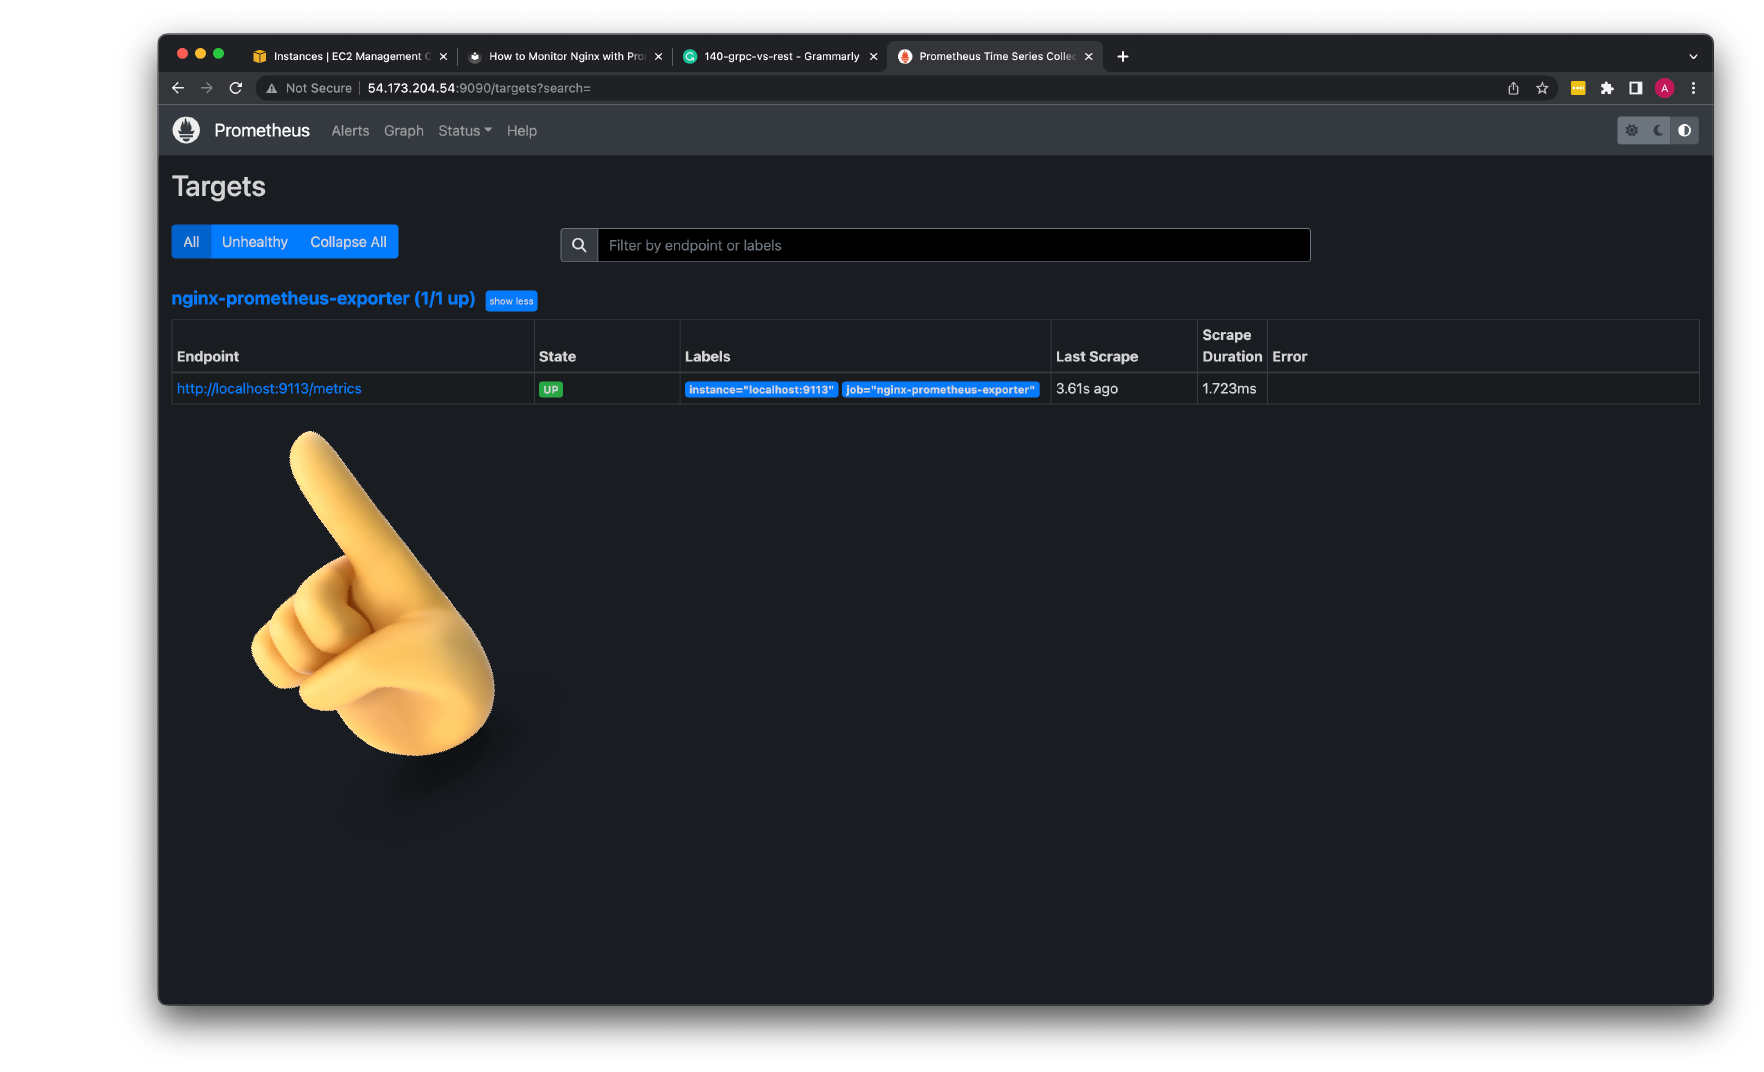
Now you can go to http://<ip>:9090/ to check if the prometheus is working.
Under the targets section, you should have a single nginx-prometheus-exporter target.
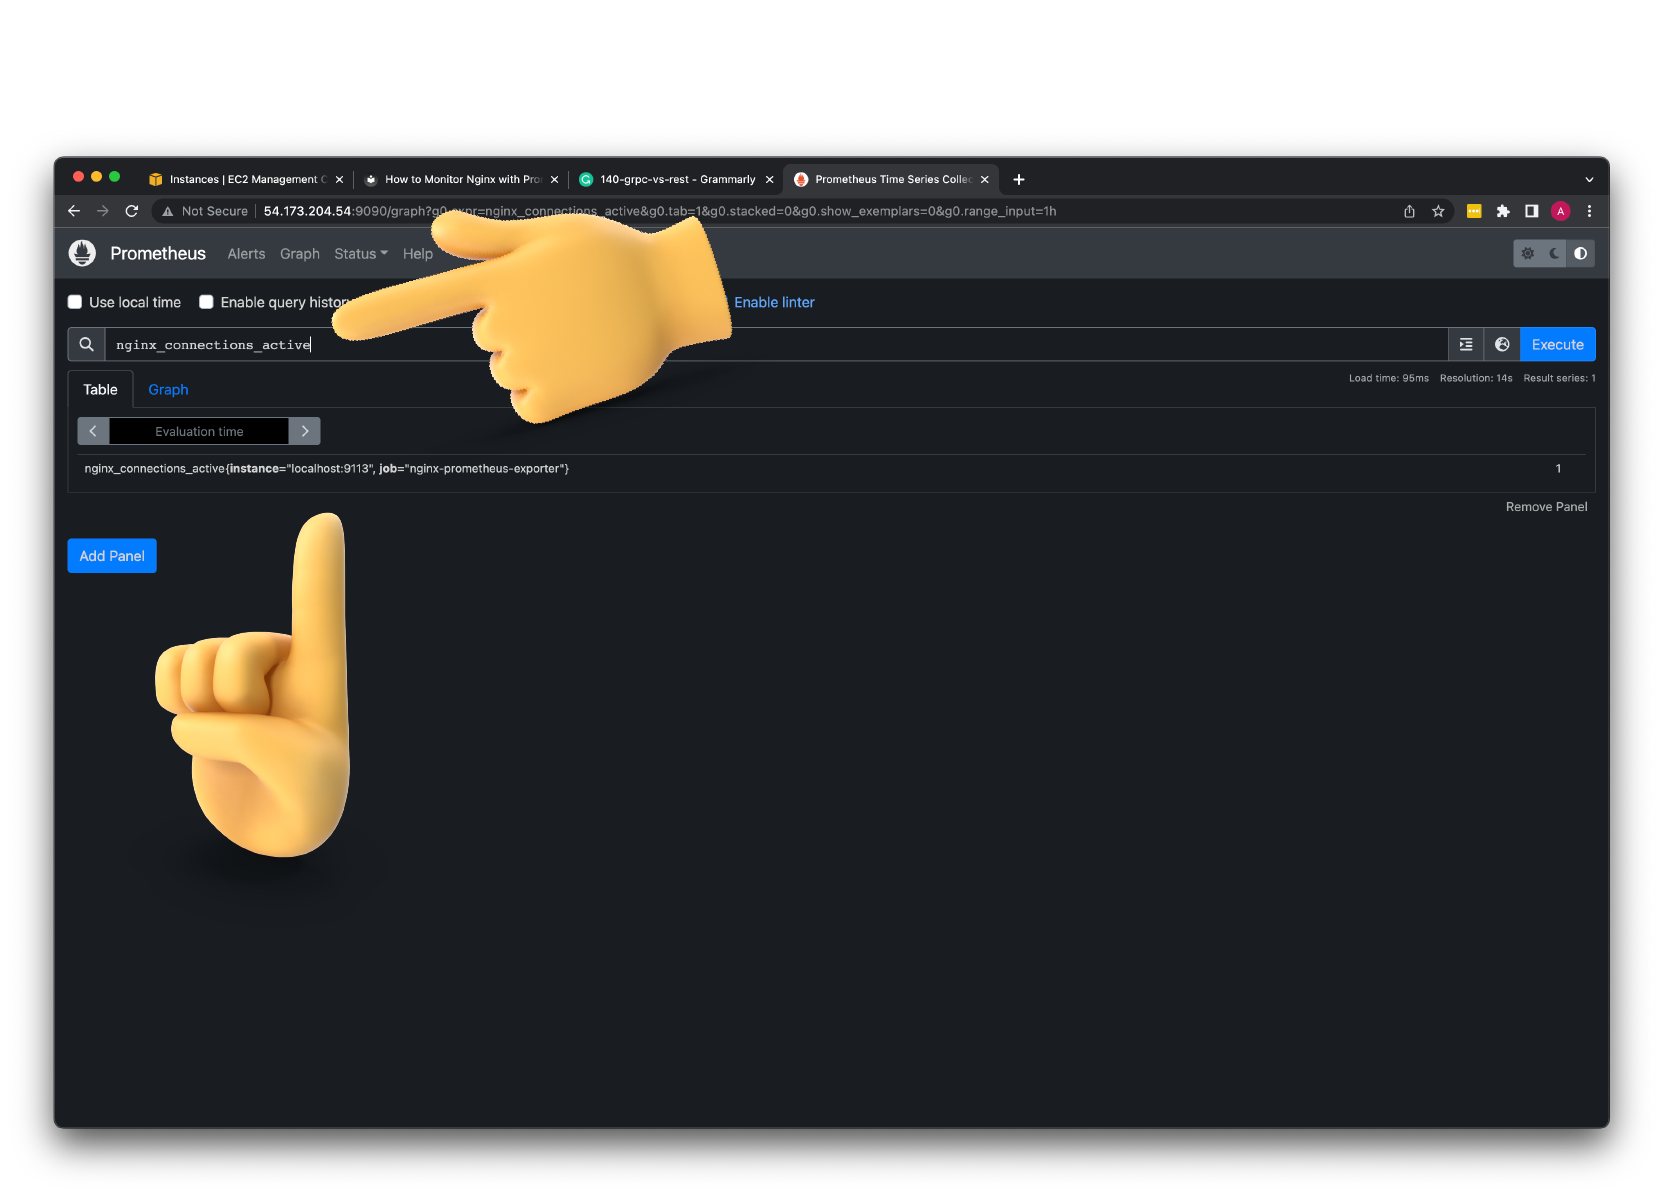
Now, you can query your metrics from the Prometheus explorer tab. For example, you can use nginx_connections_active to get active nginx connections.
Install Grafana
The next step is to install Grafana, which is much simpler since we can use official repository.
First, let's make sure that all the dependencies are installed.
Next, add GPG key.
Add this repository for stable releases.
echo "deb https://packages.grafana.com/oss/deb stable main" | sudo tee -a /etc/apt/sources.list.d/grafana.list
After you add the repository, update and install Garafana.
To automatically start the Grafana after reboot, enable the service.
Then start the Grafana.
To check the status of Grafana, run the following command
Now you can access Grafana on port http://<ip>:3000. The username is admin, and the password is admin as well.
- First of all, let's add our Prometheus as a datasource.
- For the URL, use
http://localhost:9090and click save and test. - Let's create a new dashboard and call it
Nginx. - Create a new Panel.
- For the metrics use
nginx_connections_active. - For the legend
{{ instance }}. - Title:
Active Connections.
I'm going to fill out the rest of the panels using the metrics that we retried from the status page. You can find this dashboard in my github repository.
On the left-hand side, we have all the gauges, and on the right-hand side, all the counters. To make use of the counter, you need to apply a rate function, for example, to calculate a number of requests per second.
Install Fluentd
The next step is to install Fluentd and convert Nginx logs to Prometheus metrics.
First of all, we need to install the ruby programming language.
Verify that ruby is installed successfully. You need at least a 2.7 ruby version.
Now we can install the fluentd itself using gem, which is a standard way for ruby to distribute packages.
Install the fluentd plugin to convert logs to prometheus metrics.
Verify fluentd installation. You should get the latest version.
Create a folder to place Fluentd Config.
Let's update the Nginx access log to emit additional values.
Add upstream_response_time at the end of the log. But better replace the whole string with mine to avoid any typos.
| /etc/nginx/nginx.conf | |
|---|---|
Let's save and restart Nginx.
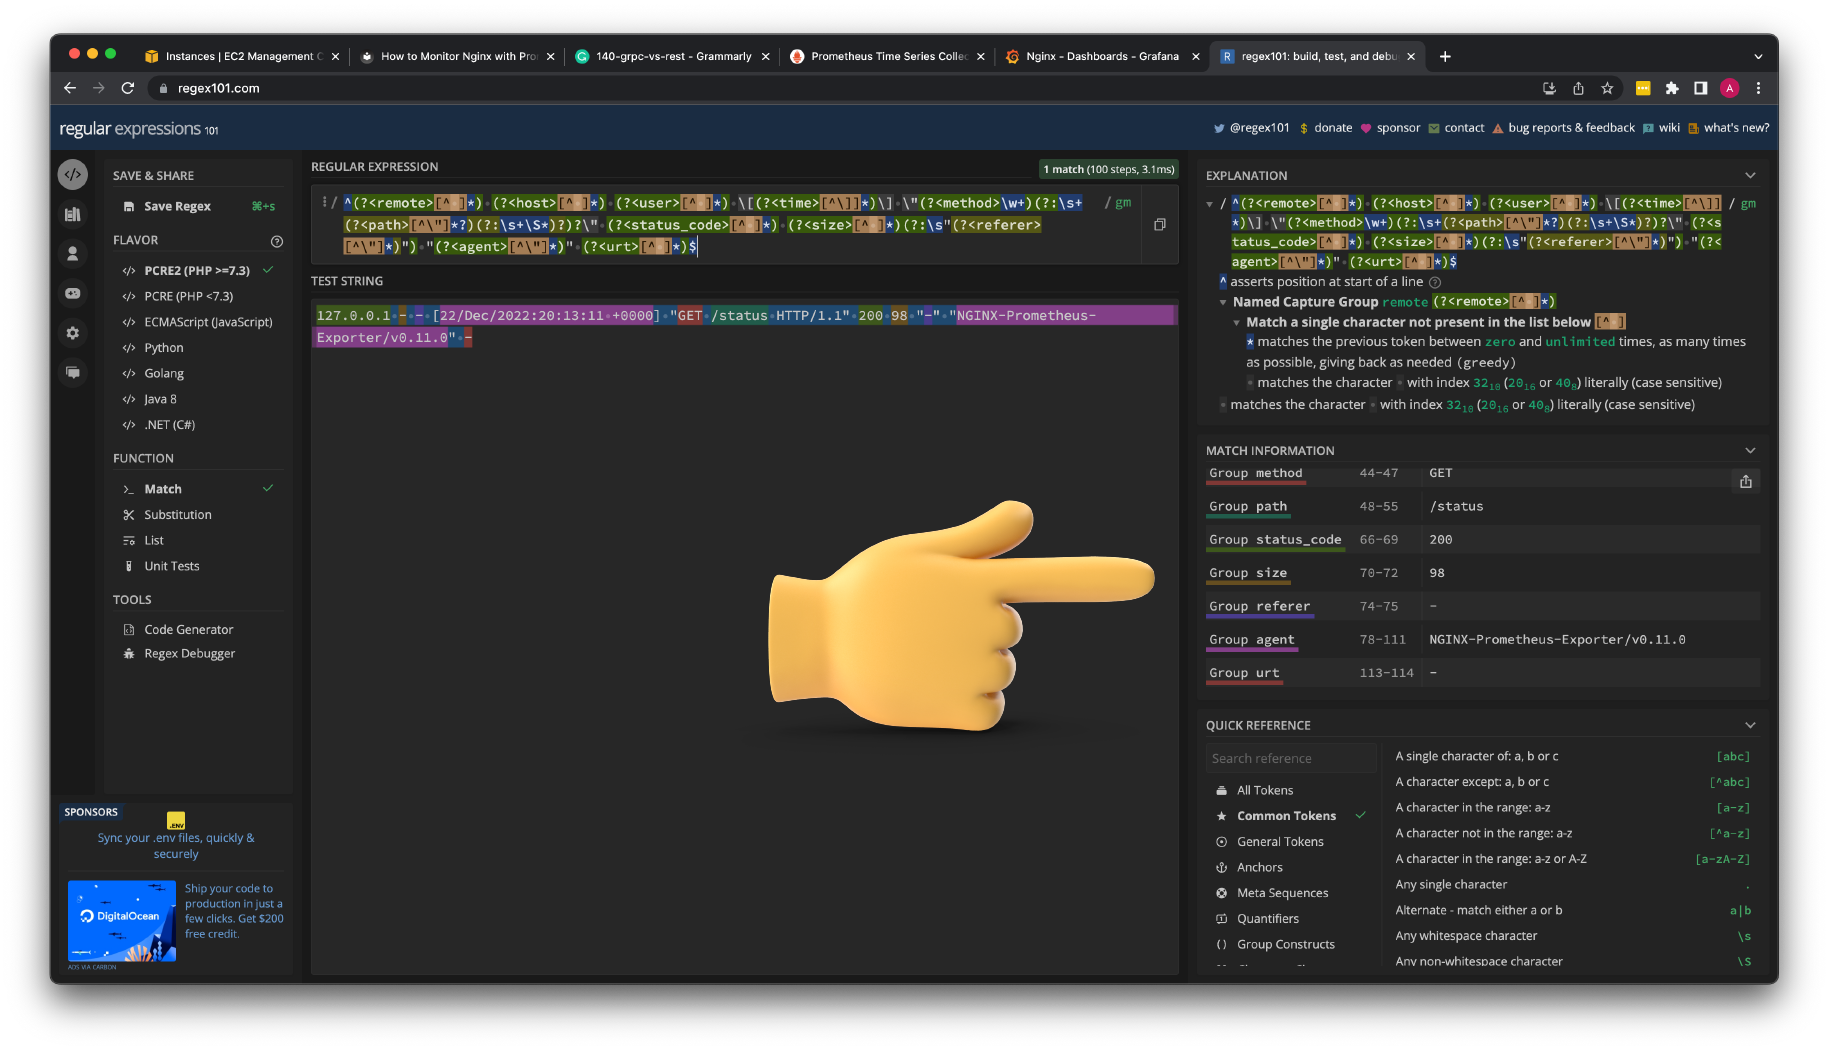
Now we need to create a regular expression to parse nginx access logs. First, let's get a sample from the log and use one of the online regex editors.
Since we don't have any upstream services, the last value is empty for now.Here we have the old logs; let's invoke one of the Nginx endpoints.
127.0.0.1 - - [22/Dec/2022:20:13:11 +0000] "GET /status HTTP/1.1" 200 98 "-" "NGINX-Prometheus-Exporter/v0.11.0" -
Let's use regex101com to create the regular expression.
^(?<remote>[^ ]*) (?<host>[^ ]*) (?<user>[^ ]*) \[(?<time>[^\]]*)\] \"(?<method>\w+)(?:\s+(?<path>[^\"]*?)(?:\s+\S*)?)?\" (?<status_code>[^ ]*) (?<size>[^ ]*)(?:\s"(?<referer>[^\"]*)") "(?<agent>[^\"]*)" (?<urt>[^ ]*)$
Paste your log sample and enter the regular expression. On the right-hand side, you'll see the named parameters, such as status code, method, size, and others. All of them we will be able to convert to prometheus and use them as labels.
Now let's create the Fluentd config.
You'll find the metric sections where we convert logs to prometheus metrics. For example, to measure latency, we use nginx_upstream_time_seconds_hist.
<source>
    @type prometheus_tail_monitor
</source>

<source>
  @type prometheus
</source>

<source>
    @type tail
    <parse>
    @type regexp
    expression /^(?<remote>[^ ]*) (?<host>[^ ]*) (?<user>[^ ]*) \[(?<time>[^\]]*)\] \"(?<method>\w+)(?:\s+(?<path>[^\"]*?)(?:\s+\S*)?)?\" (?<status_code>[^ ]*) (?<size>[^ ]*)(?:\s"(?<referer>[^\"]*)") "(?<agent>[^\"]*)" (?<urt>[^ ]*)$/
        time_format %d/%b/%Y:%H:%M:%S %z
        keep_time_key true
        types size:integer,reqtime:float,uct:float,uht:float,urt:float
    </parse>
    tag nginx
    path /var/log/nginx/access.log
    pos_file /tmp/fluent_nginx.pos
</source>
<filter nginx>
    @type prometheus

  <metric>
    name nginx_size_bytes_total
    type counter
    desc nginx bytes sent
    key size
  </metric>

  <metric>
    name nginx_request_status_code_total
    type counter
    desc nginx request status code
    <labels>
      method ${method}
      path ${path}
      status_code ${status_code}
    </labels>
  </metric>

  <metric>
    name nginx_http_request_duration_seconds
    type histogram
    desc Histogram of the total time spent on receiving the response from the upstream server.
    key urt
    <labels>
      method ${method}
      path ${path}
      status_code ${status_code}
    </labels>
  </metric>

</filter>
Create the last systemd service unit for fluentd to run it in the background. Let's run it as a root to grant access to Nginx logs. Of course, I would advise you to downgrade it to its own user.
| fluentd.service | |
|---|---|
As always, enable, start and check the status.
You can access Prometheus metrics on localhost:24231/metrics.
Let's add another Prometheus target to scrape fluentd.
| /etc/prometheus/prometheus.yml | |
|---|---|
Restart Prometheus.
Now you should have 2 targets in the Prometheus UI.
Create Simple Flask App
For the final test, let's create a simple Flask app to test our metrics.
Install the pip package manager for python if you don't have it yet.
Install Flask, which is an http framework for Python.
Install gunicorn, which is a production-grade server for flask applications.
Create a folder for the app.
Now let's create the app itself.
It's a very simple HTTP api that has a single /api/devices endpoint and supports get and post methods. Also, we simulate a load by generating the random sleep interval.
Create a dedicated user for the flask app.
Update ownership on the folder.
Create the systemd service for the app.
Enable, start and check the app.
Now, check if you can access the flask app locally.
The next step is to use Nginx as a reverse proxy for our app.
Let's also add a few headers just in case the flask needs to know where the request is coming from.
| /etc/nginx/conf.d/myapp.conf | |
|---|---|
Remove the default Nginx config with hello world page.
Test and reload Nginx config.
Now we can use the Nginx ip address to test the app. http://<ip>/api/devices
Finally, let's create a few more Grafana dashboards to use these metrics.