How to Monitor Golang with Prometheus (Counter - Gauge - Histogram - Summary)
- You can find the source code for this video in my GitHub Repo.
Create Minimal App
First of all, let's create a folder for the golang app. If you are on Linux or on mac, you can run the following command:
Then we need to switch to the my-app directory.
Start your module using the go mod init. Replace the path to your source code repository.
Now, let's create the bare minimum application to expose default Golang metrics via the http://localhost:8081/metrics endpoint. For this tutorial, we're going to use a standard http module to create an HTTP API to manage hardware devices.
| my-app/main.go | |
|---|---|
Run go mod tidy to download the golang prometheus client.
To start the app, you can run go run main.go.
To get default metrics exposed by the go app, you can use curl.
# HELP go_gc_duration_seconds A summary of the pause duration of garbage collection cycles.
# TYPE go_gc_duration_seconds summary
go_gc_duration_seconds{quantile="0"} 0
go_gc_duration_seconds{quantile="0.25"} 0
go_gc_duration_seconds{quantile="0.5"} 0
go_gc_duration_seconds{quantile="0.75"} 0
go_gc_duration_seconds{quantile="1"} 0
...
Most of the time, these metrics are not very useful. It's a good practice only to expose and collect metrics that you actually need. Especially if you use one of the many managed prometheuses that charge by the number of metrics and the storage. Moving forward, we'll disable default metrics.
Gauge
We'll start with gauge metric type. It represents a single numerical value that can arbitrarily go up and down. For example, you can use it to measure current memory usage or the number of concurrent requests.
We'll use it to keep track of the number of connected hardware devices to our app. Also, the typical use case for the gauge metric is to expose some metadata about the app, for example, the app version using the label.
Let's go ahead and create a struct to represent the hardware device. It's going to have an id, a mac address, and a firmware version.
| my-app/main.go | |
|---|---|
Then declare the slice of devices as a global variable to hold all the connected devices.
| my-app/main.go | |
|---|---|
Use the special init() function to create a couple of devices. The init() function will run before the main() and is used when you need to set up some form of state on the initial startup of your program.
| my-app/main.go | |
|---|---|
Now, let's create an http handler function that returns all the connected devices to this instance.
- Use
json.Marshalfunction to convert go structs to the JSON string. - Check for the error and return the bad request status code in case of a conversion error.
- Then set the
Content-Typeheader toapplication/jsonand use the200HTTP status code. - Finally, write the data to the connection.
| my-app/main.go | |
|---|---|
In the main function, add a new /devices endpoint and use getDevices handler function that we just created.
| my-app/main.go | |
|---|---|
Use curl to check if we can return connected devices.
You should get 2 devices.
HTTP/1.1 200 OK
Content-Type: application/json
Date: Thu, 01 Dec 2022 12:11:30 GMT
Content-Length: 109

[{"id":1,"mac":"5F-33-CC-1F-43-82","firmware":"2.1.6"},{"id":2,"mac":"EF-2B-C4-F5-D6-34","firmware":"2.1.6"}]
It's time to declare our first metric. We're going to use a Gauge to maintain a number of devices connected to this app.
Create metrics struct and set devices property to prometheus.Gauge type. You may notice that you can use either Gauge or a GaugeVec. The difference is very simple. Gauge represents a single numerical value when GaugeVec is a collection that bundles a set of Gauges with the same name but different labels.
For example, if you want to count all connected devices and you don't care about the different types, use a Gauge. On the other hand, if you have different device types, such as routers, switches, and access points, and you want to count them separately, use GaugeVec with a type label. You'll see a bunch of examples during this tutorial.
Then create a NewMetrics function that defines metrics. It accepts the prometheus register and returns the pointer to the metrics struct.
- We need to create
devicesmetric using theNewGaugefunction. - A
Namespaceis just a metric prefix; usually, you use a single word that matches the name of your app. In my case, it'smyapp. - Then the metric
Name. It's very important to follow the naming conventions provided by Prometheus. You can find it on the official website. Let's call itconnected_devices. - You also need to include a metric description.
- Then register it with the prometheus registry and return a pointer.
| my-app/main.go | |
|---|---|
- In the
main()function, create a non-global registry without any pre-registeredCollectors. - Then create metrics using the
NewMetricsfunction. - Now we can use the
devicesproperty of the metrics struct and set it to the current number of connected devices. For that, we simply set it to the number of items in the devices slice. - Let's also create a custom prometheus handler with the newly created register.
- We also need to update the
/metricshandler topromHandler.
| my-app/main.go | |
|---|---|
If you try to scrape the /metrics endpoint right now, you should get a single connected_devices metric with the value of 2.
# HELP myapp_connected_devices Number of currently connected devices.
# TYPE myapp_connected_devices gauge
myapp_connected_devices 2
Optionally, if you still want to keep all the golang default metrics, you can use a built-in collector to register it with the custom Prometheus register.
Also, you can expose the prometheus handler metric as well by adding setting the Registry field.
The next info metric will represent the metadata of the app. You can expose any number of arbitrary key-value pairs from your application. As an example, we'll expose the version of the currently running app.
This time this will be GaugeVec type since we need to set a version label with the actual version of the application.
- Let's declare
infometric usingNewGaugeVecfunction. - All the metrics will get the same
Namespacewith the name of the app. - Using the same naming convention, let's call it
infoas well and give it a description. - Don't forget to register it using
MustRegisterfunction.
Then declare a global version variable.
| my-app/main.go | |
|---|---|
Typically this variable will be set using the environment variable or by your CI tool. For the demo, let's just hardcode it in the init() function.
| my-app/main.go | |
|---|---|
Then in the main() function, we can use the version Prometheus label to set the application version and use a constant value of 1. If you check the default golang info metric, it uses the same convention.
If you check the /metrics endpoint, you should get the info metric with the version of your app. I'll show you later how to use it in Grafana.
...
# HELP myapp_info Information about the My App environment.
# TYPE myapp_info gauge
myapp_info{version="2.10.5"} 1
It's more common than you may think to expose the prometheus metrics endpoint using a different port. It helps to keep it secure and private by configuring the firewall rules and access lists.
For example, in AWS, if you deploy your application using EC2 instances and Elastic Load Balancer. You can easily expose your main port/endpoint to the internet and keep prometheus metrics endpoint private and protected.
Since we don't use any 3rd party routers and frameworks, I'll show you a very simple way to run multiple servers using goroutines.
The key is to create separate http request multiplexers.
- The first one is the default multiplexer we'll use to serve the main content.
- Replace
httpwith your custom multiplexer. - Then the second one is for prometheus.
- Spin up the first goroutine for the main server and the second one for the prometheus metrics endpoint.
- Then to prevent the
main()function from exiting, we can use aselectstatement that blocks until our goroutines are running.
Now, if you access localhost:8080/devices, you get the connected devices.
[{"id":1,"mac":"5F-33-CC-1F-43-82","firmware":"2.1.6"},{"id":2,"mac":"EF-2B-C4-F5-D6-34","firmware":"2.1.6"}]%
But to get metrics, you would use localhost:8081/metrics endpoint.
# HELP myapp_connected_devices Number of currently connected devices.
# TYPE myapp_connected_devices gauge
myapp_connected_devices 2
# HELP myapp_info Information about the My App environment.
# TYPE myapp_info gauge
myapp_info{version="2.10.5"} 1
The next step is to set up Prometheus and Grafana locally using docker and docker-compose. It's optional but can help to visualize your metrics.
The next step is to set up Prometheus and Grafana locally using docker and docker-compose. It's optional but can help to visualize your metrics. Let's create a Dockerfile. I'm not going to spend a lot of time on it.
- In the first stage, we want to import files and build a golang binary.
- In the second stage, we take a distroless image and copy our binary there.
For the local development, you can just use a single stage and perhaps find a way to reload and rebuild the image automatically on any change.
| my-app/Dockerfile | |
|---|---|
To run it locally, we'll use docker-compose. In that file, define the myapp service and specify the path to the application. Docker-compose will automatically build the image when we run up command. We also want to expose ports 8080 and 8081 with the prometheus metrics.
By the way, the service name, in this case, myapp, also becomes the fully qualified domain name that can be used by other services in this docker-compose file. For example, Prometheus will use it to find its targets.
| docker-compose.yaml | |
|---|---|
To start the app, run docker-compose up. We also need to add for the future run --build argument. When we make any changes to the source code, we need to rebuild the docker image.
Now, test with curl if you can access localhost:8080/devices and localhost:8081/metrics endpoints.
[{"id":1,"mac":"5F-33-CC-1F-43-82","firmware":"2.1.6"},{"id":2,"mac":"EF-2B-C4-F5-D6-34","firmware":"2.1.6"}]
# HELP myapp_connected_devices Number of currently connected devices.
# TYPE myapp_connected_devices gauge
myapp_connected_devices 2
# HELP myapp_info Information about the My App environment.
# TYPE myapp_info gauge
myapp_info{version="2.10.5"} 1
The next step is to run Prometheus.
- Create a folder
prometheusand the corresponding configuration file. - For the scrape interval, you can use such small values, but in production, you want to increase them to at least
15or30seconds. - We're not going to specify the alertmanager and any rules.
- We'll use static scrape with the domain name of
myapp. If you don't use docker-compose and run it locally, just specifylocalhost:8081.
We don't need to provide the /metrics path because it's the default. In case you use any different path, such as /prom-metrics, you'll need to specify it as well.
| prometheus/prometheus.yml | |
|---|---|
Now, in the docker-compose, add the prometheus service with the latest docker image.
- Expose prometheus
9090port to localhost. - Finally, provide the path to the local configuration file.
| docker-compose.yaml | |
|---|---|
Let's rerun docker-compose; you can omit the build if you want.
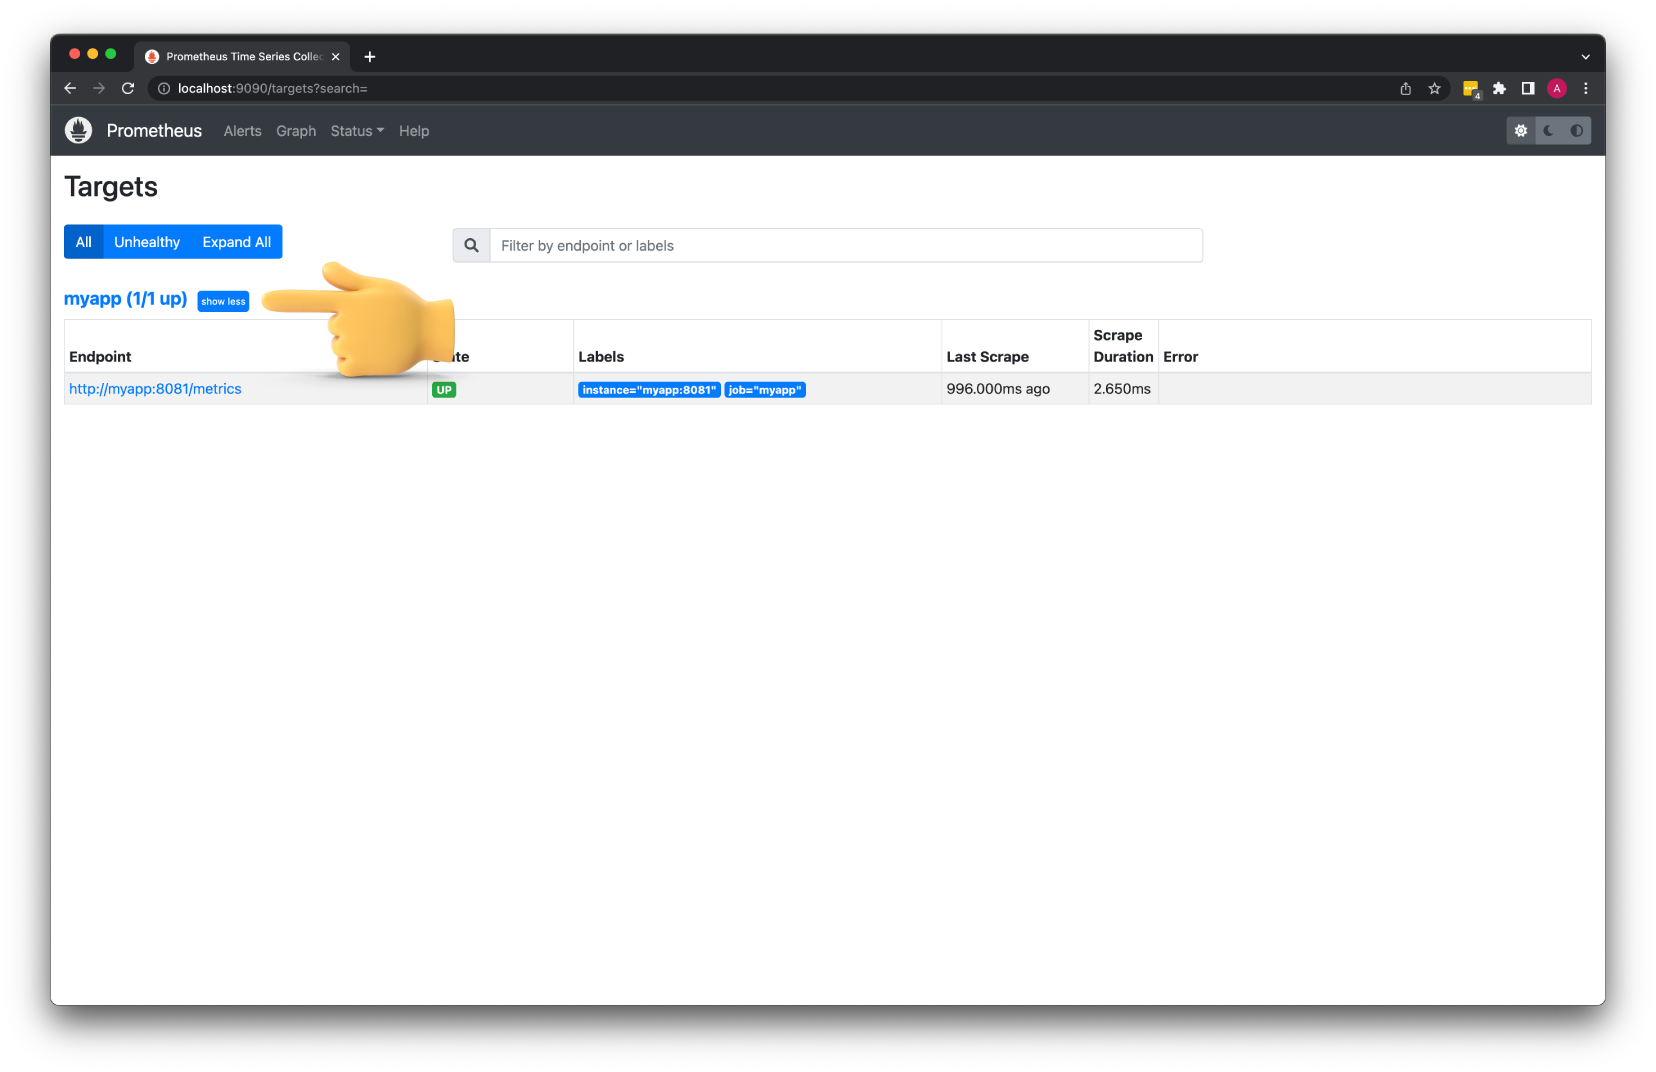
If you navigate to localhost:9090, you should see Prometheus UI. Under the targets section, we can find a single myapp target.
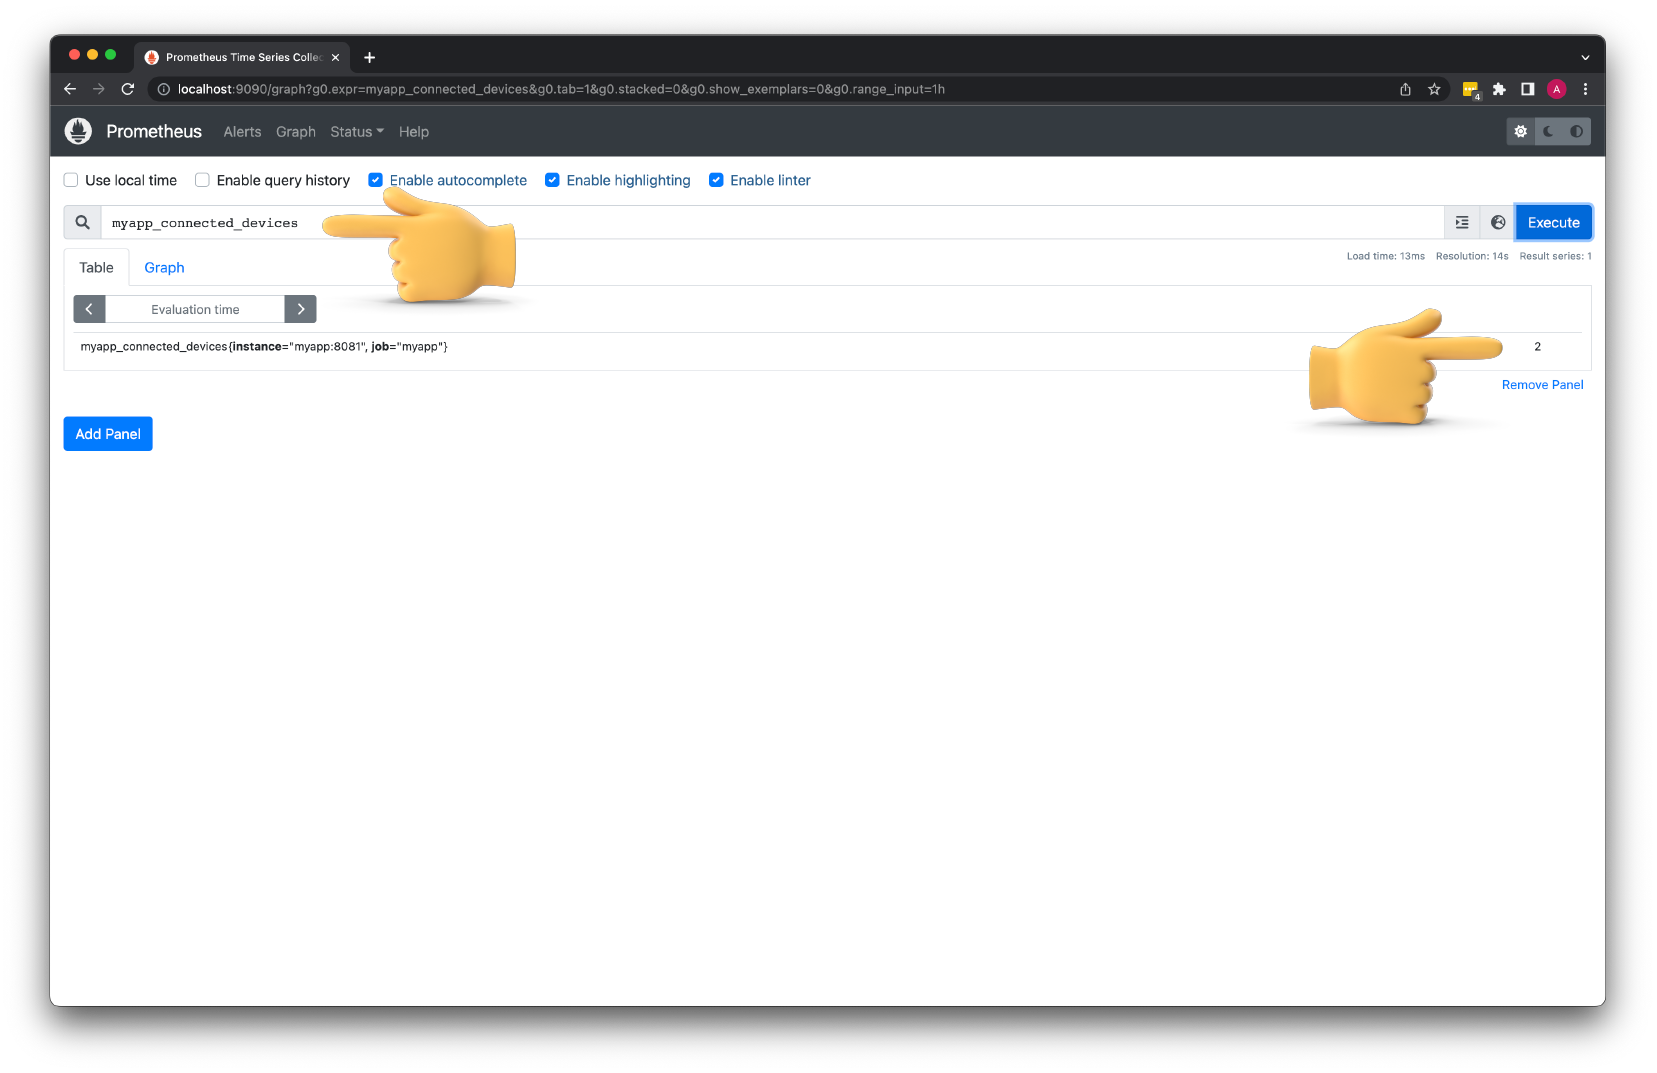
From the Prometheus explorer tab, you can enter myapp_connected_devices metric and execute. You should get 2 connected devices.
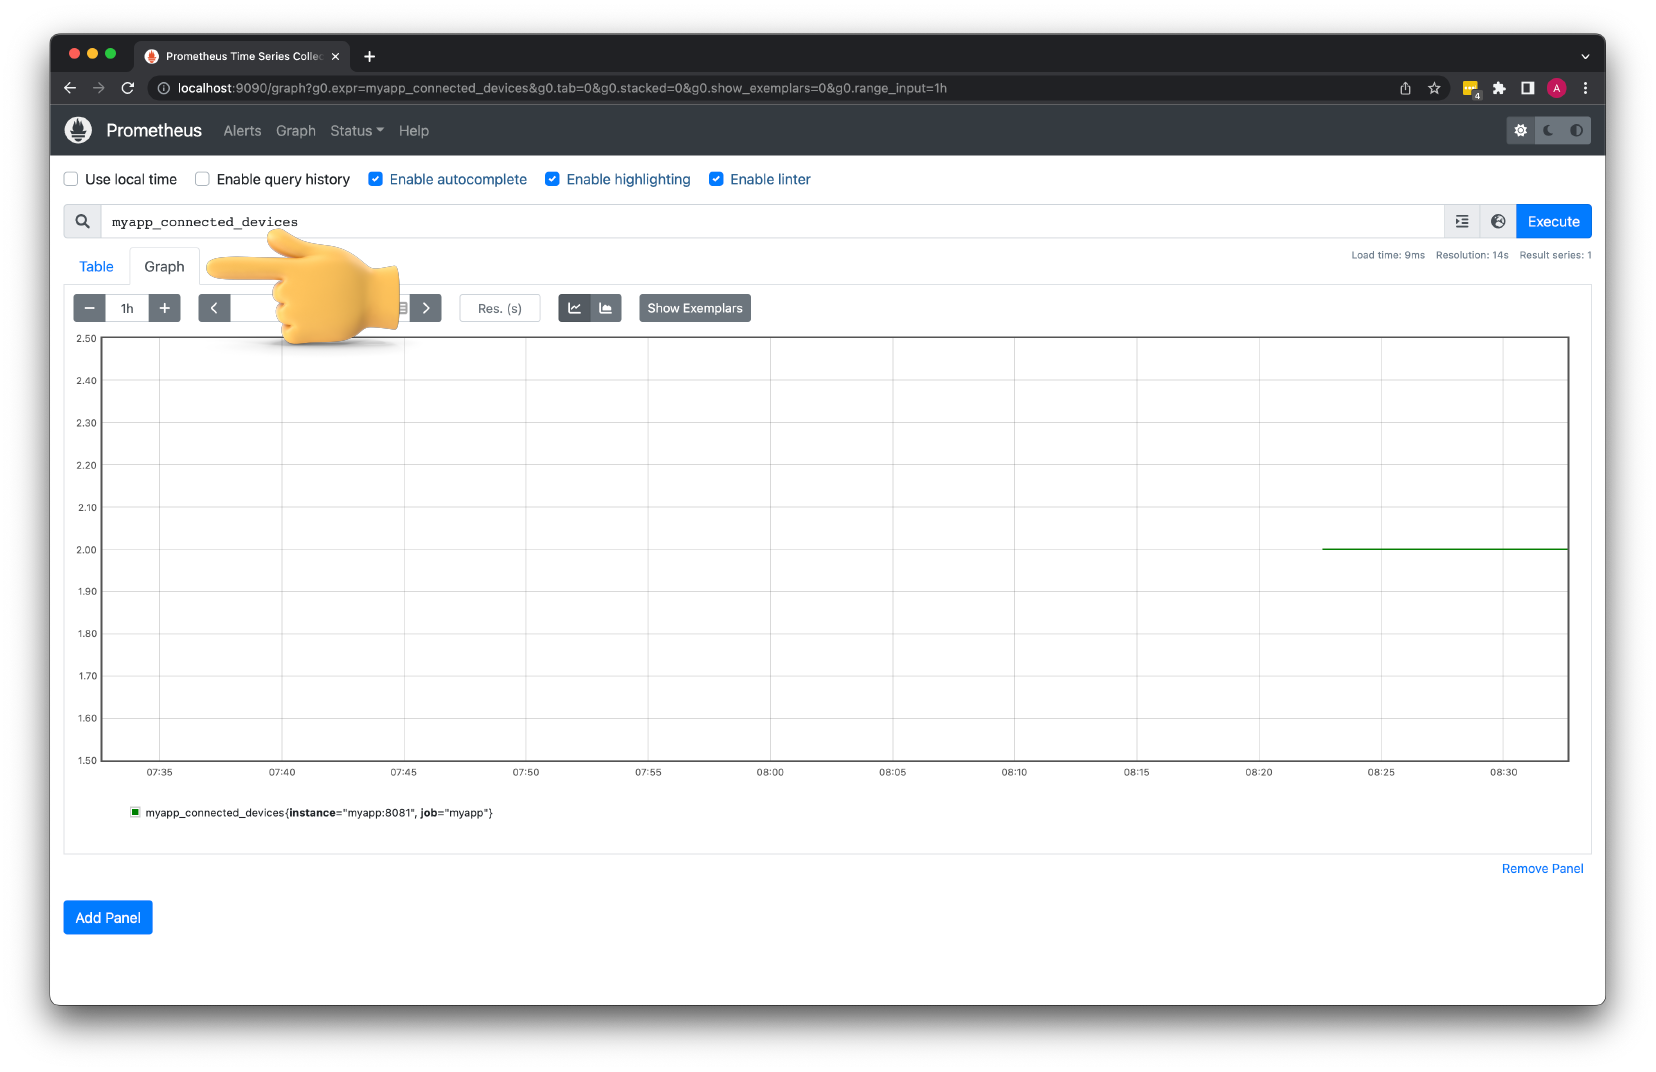
There is also a Graph tab to visualize metrics, but most of the time, I use Grafana for that purpose.
Next is Grafana. We can add a new datasource using code.
- Let's call it
Mainand useprometheus:9090URL.
| grafana/datasources.yaml | |
|---|---|
Then add the grafana service to the docker-compose file.
- Expose port
3000to the local host. - Set the admin user and password using environment variables.
- Mount the datasource file that we just created to the grafana container.
- If you want to persist data such as dashboards between restarts, you must create a volume and mount it to the container.
Let's run docker-compose up again and visit Grafana on localhost:3000.
The username is admin, and the password is devops123.
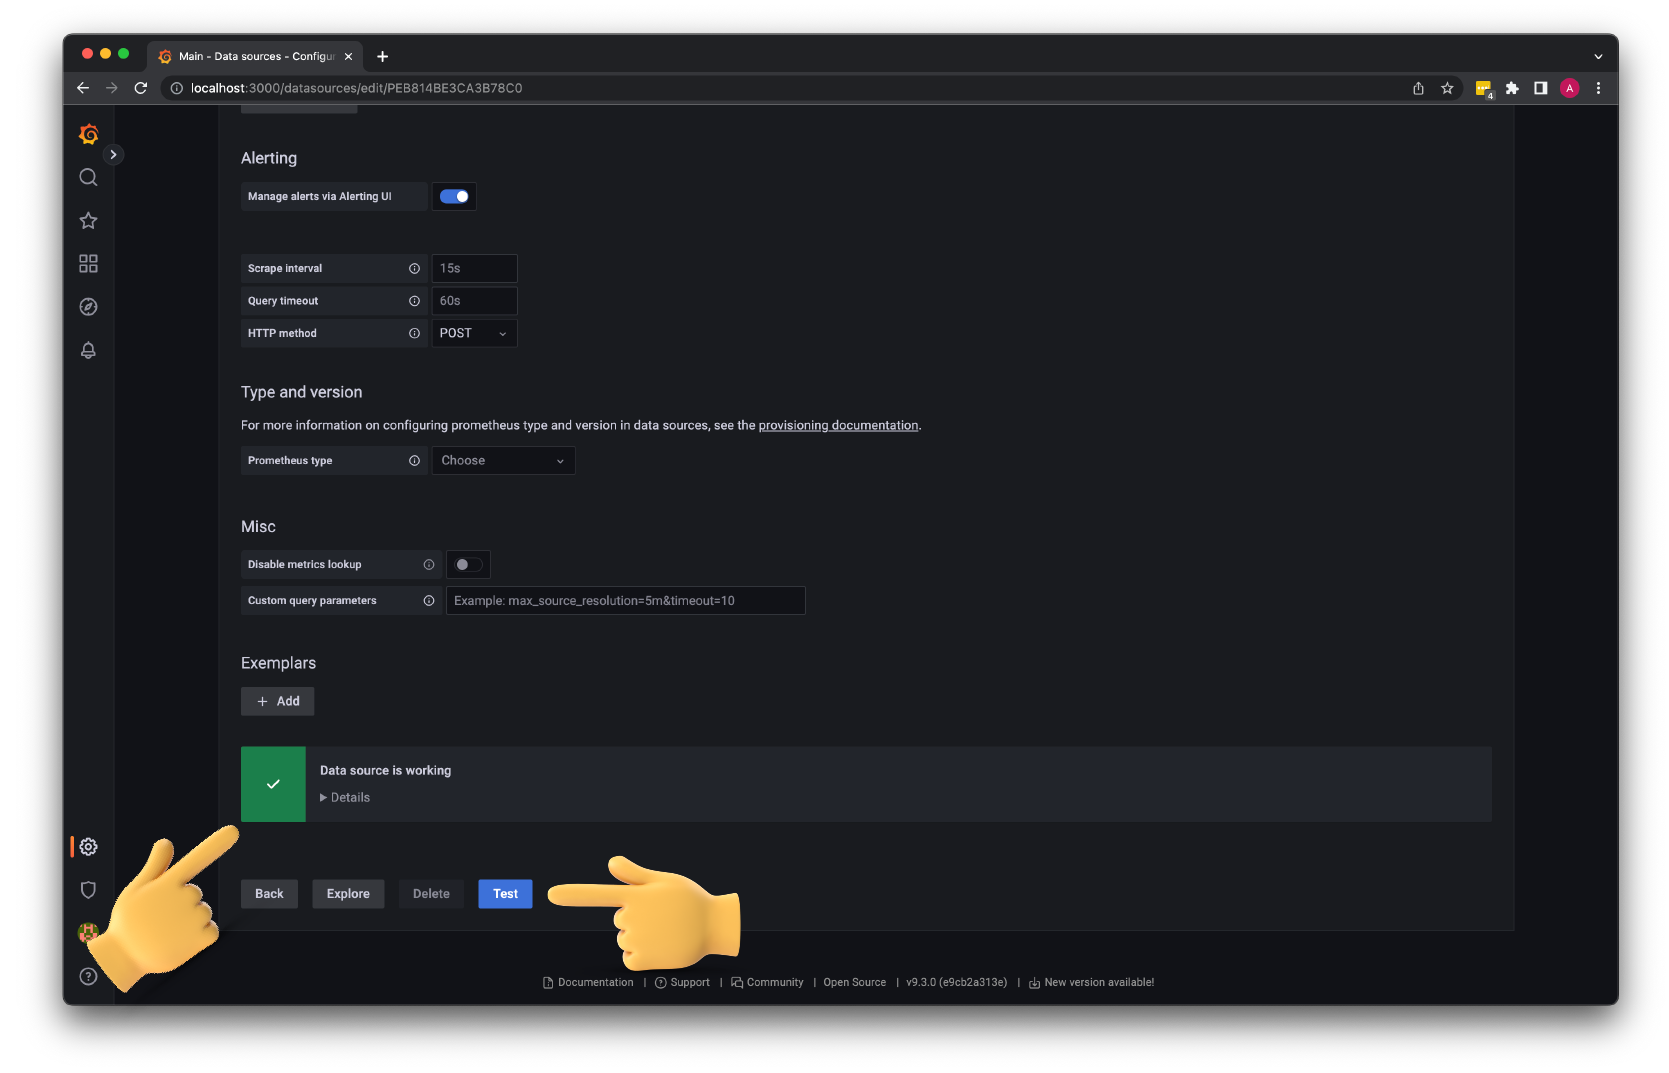
First of all, make sure that the datasource is properly configured.
Then create a new dashboard; let's call it My App.
- Add a new panel.
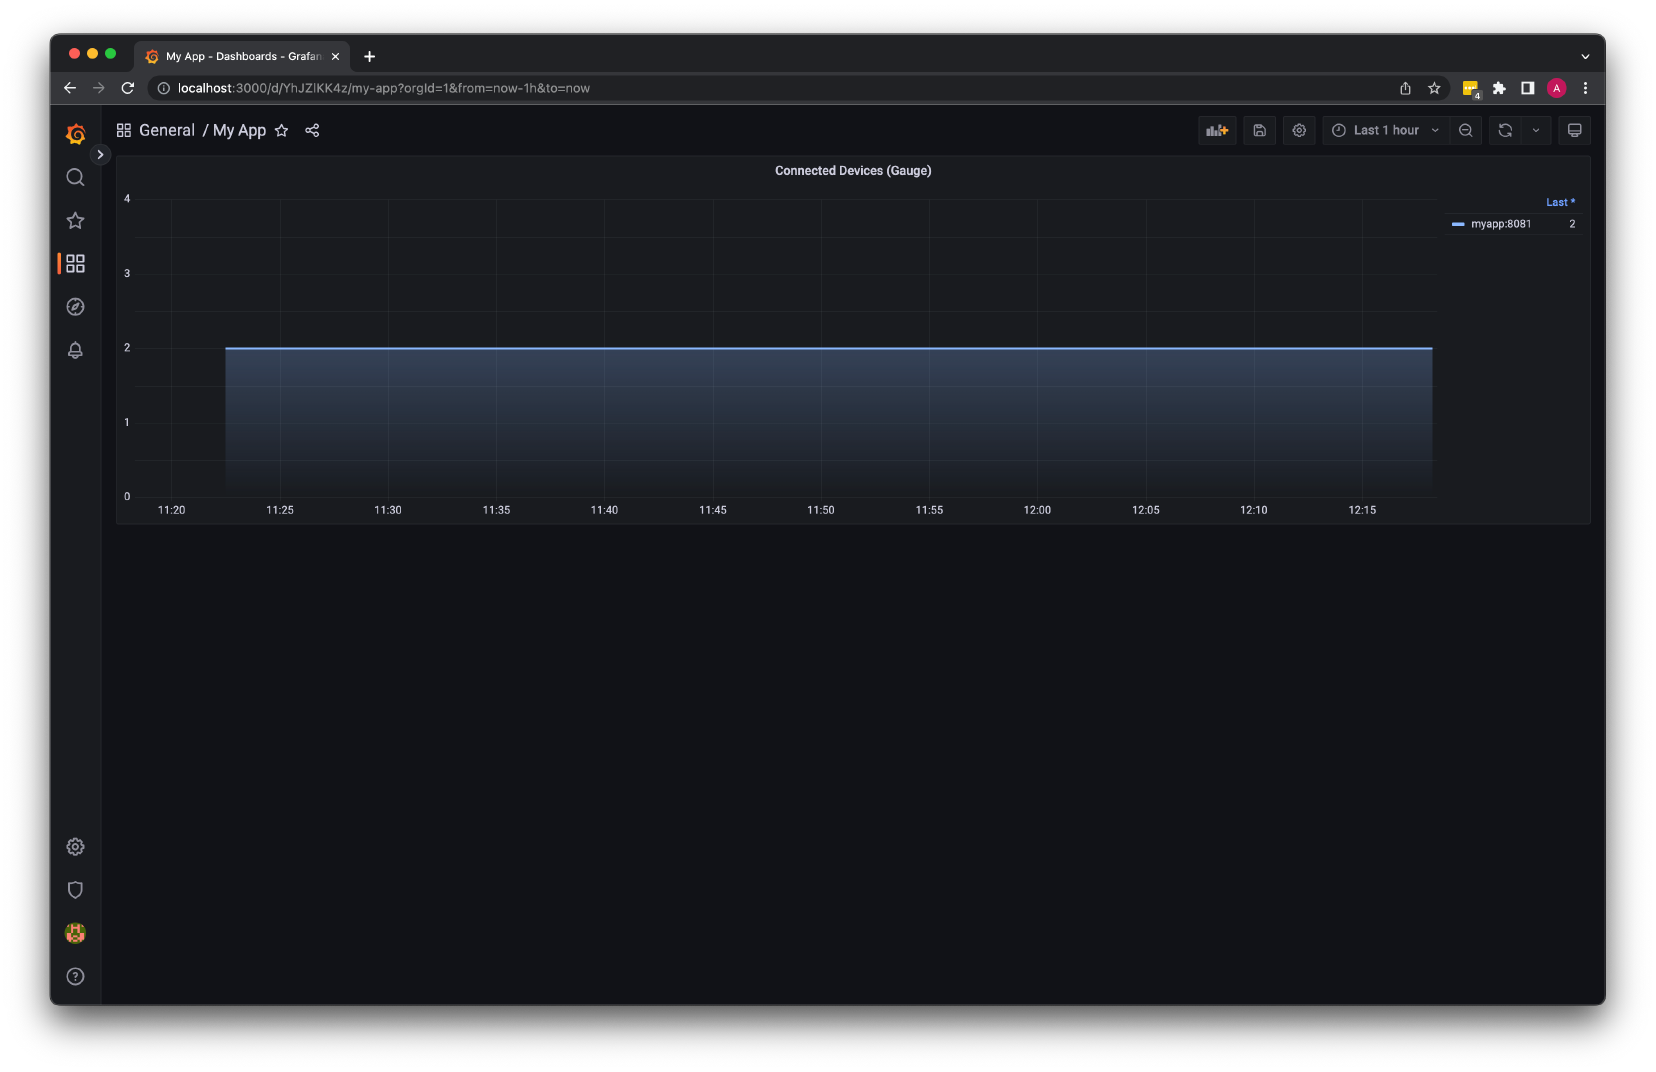
- For the
Title, let's useConnected Devices (Gauge). - Make sure that the
Mainprometheus datasource is selected. - Use the same metric,
myapp_connected_devices, to get all the connected devices to our app. - For the
Legend, we can use{{ instance }}label, which is automatically assigned by the prometheus. - Change the time interval to
Last 1 hour.
Now, let's start customizing our chart.
- Let's shift the
Legendto theRightand transform it into theTable. - Choose the
Lastnon-null value. - Change
Line interpolationtosmooth. - Increase the
Line widthto2and set theFill opacityto50. - Also, change the
Gradient modefromNonetoOpacity. - Optionally you can
Connect null values. - For the
Unit, useshort. - Set
Decimalsto0. - Lastly, let's change the
Color schemetolight blueor any other color you want.
That's all; this is our first graph.
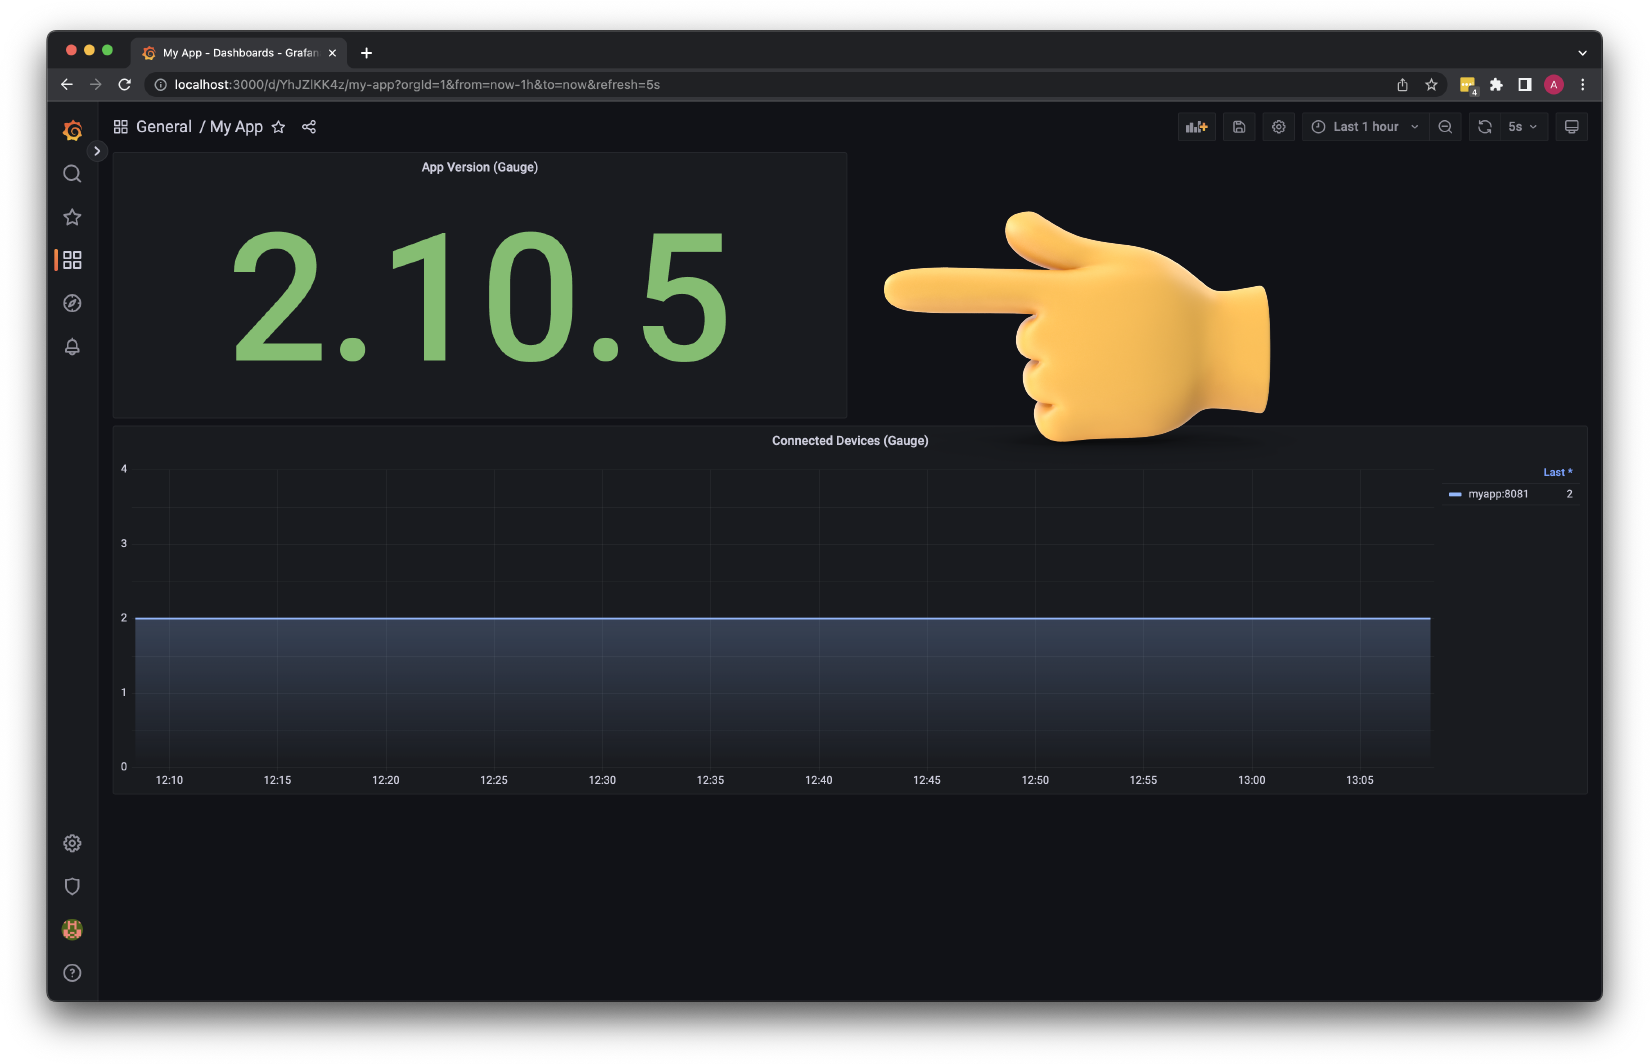
Next, let's create another panel to display the current version of the app.
- Change the
TitletoApp Version (Gauge). - Also, update the chart type to
Stat. - For the metric, use
myapp_info. - Change the query
TypefromRangetoInstant. - For the legend, let's use
{{ version }}label. - Set
Text modetoNameandGraph modetoNone.
It's not perfect; every time you upgrade your app, you'll see multiple versions for 5 minutes, and after that, the single version is displayed.
Let's add functionality to our app to register new devices.
- Create a new
createDevicefunction with the same signature as any other http handler. - Then declare the device variable.
- This function will accept the device as a
JSONobject from the client and decode it to the golangstruct. - Since we use a global variable to maintain connected devices, let's append this device to
dvsslice. - Set the HTTP status code to
201and returnDevice created!to the client.
| my-app/main.go | |
|---|---|
The standard http request multiplexer doesn't have functionality to route requests based on the HTTP methods such as GET, POST, etc. To implement this, we need to create another handler and use a switch statement.
- Let's call it
registerDevices. - Use the
switchon the request method. - If the method is
GET, we want to use our firstgetDevicesfunction. - If the method is
POST, use the newcreateDevicefunction. - In case we receive a request with the unsupported method, we want to indicate what methods are available and send the error to the client.
| my-app/main.go | |
|---|---|
- Then update
getDeviceshttp handler toregisterDevices.
This time when you run docker-compose, make sure to include the build flag since we updated the source code.
To create a new device, use curl and provide the JSON object.
To check if the device was created, use the GET request.
Now, every time when we create a new device, we want to increment the corresponding metric. In this tutorial, I'll show you a few methods, from creating our custom http handlers to the middleware.
Let's start with the custom handler. In order to confirm to the handler interface, we need to implement a single ServeHTTP function with the same signature as the http handler. That's the only requirement.
First of all, let's create registerDevicesHandler struct, and include a metrics property that we can pass later to increment the device count.
We can update existing registerDevices function to ServeHTTP. Then add metrics as additional argument to the createDevice function.
| my-app/main.go | |
|---|---|
In the createDevice function, add metrics as a third argument. To increment the device count, you can use Inc() method.
In general, it's recommended to use Set() instead with Gauge type metrics due to performance benefits. On the other hand, it's better to use increment on the Counter type than Set(). Let's use the latter.
- In the
main()function, we need to initializeregisterDevicesHandlerand pass a pointer to themetricsstruct. - Then replace the handler on the
/devicesendpoint.
To test this functionality, rebuild the app.
You can use the same command to create a new device.
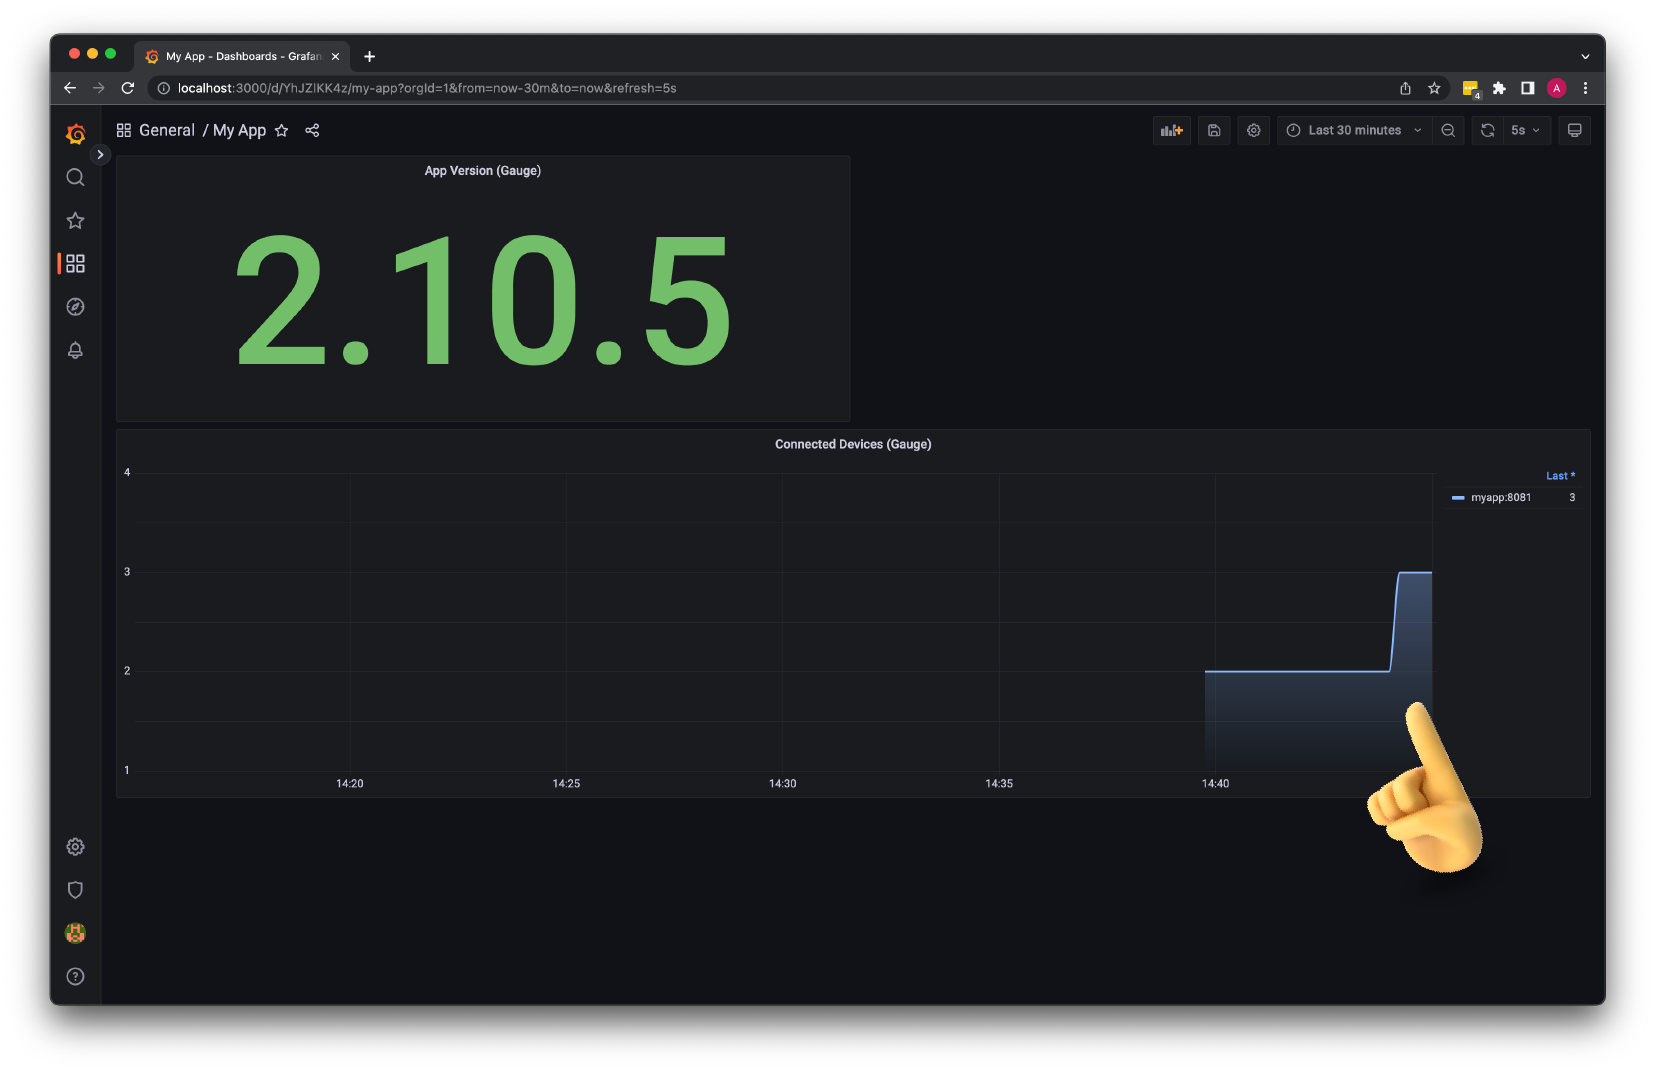
In the Grafana dashboard, you can see that the metric went up.
Counter
The next metric type that we're going to implement is a counter. It is a cumulative metric that represents a single monotonically increasing counter. It can only go up and be reset to zero on restart. Typically you would use it with the rate function and measure the number of requests served, tasks completed, or errors. We're going to use it to count device upgrades.
Let's declare it as a CounterVec to add custom labels. We'll use a label to count upgrades of different device types. For example, the type can be a router, access point, modem, etc.
| my-app/main.go | |
|---|---|
- Add it to the
NewMetricsfunction. - Let's name it
device_upgrade_totaland give it a descriptionNumber of upgraded devices. - Provide a single
typelabel, and don't forget to register it usingMustRegisterfunction.
- Next, create
upgradeDevicefunction that accepts writer, request, and metrics. - To get the
idof the device, let's trim the path. - Then try to convert the
idto theintegerand return an error if it fails. - To accept the firmware version, we'll reuse the same
Devicestruct to decode JSON to the device object. - Then find the device by the provided
idand update thefirmwareversion. - To increment the counter, use a
routertypelabel andInc()method. - Return
202HTTP status code and sendUpgrading...message to the client.
We also need to create a custom http handler with metrics property.
For the upgrade of the device, we typically use PUT HTTP method. On any other request, send Method Not Allowed.
In the main() function, we need to initialize the new manageDevicesHandler and add additional /devices/ path with a / at the end.
Rebuild the app.
Until you upgrade at least once, you won't see a new metric in the prometheus. Let's use curl to upgrade a device a couple of times.
Now, in the prometheus, you can execute myapp_device_upgrade_total query to get the number of times your devices were upgraded.
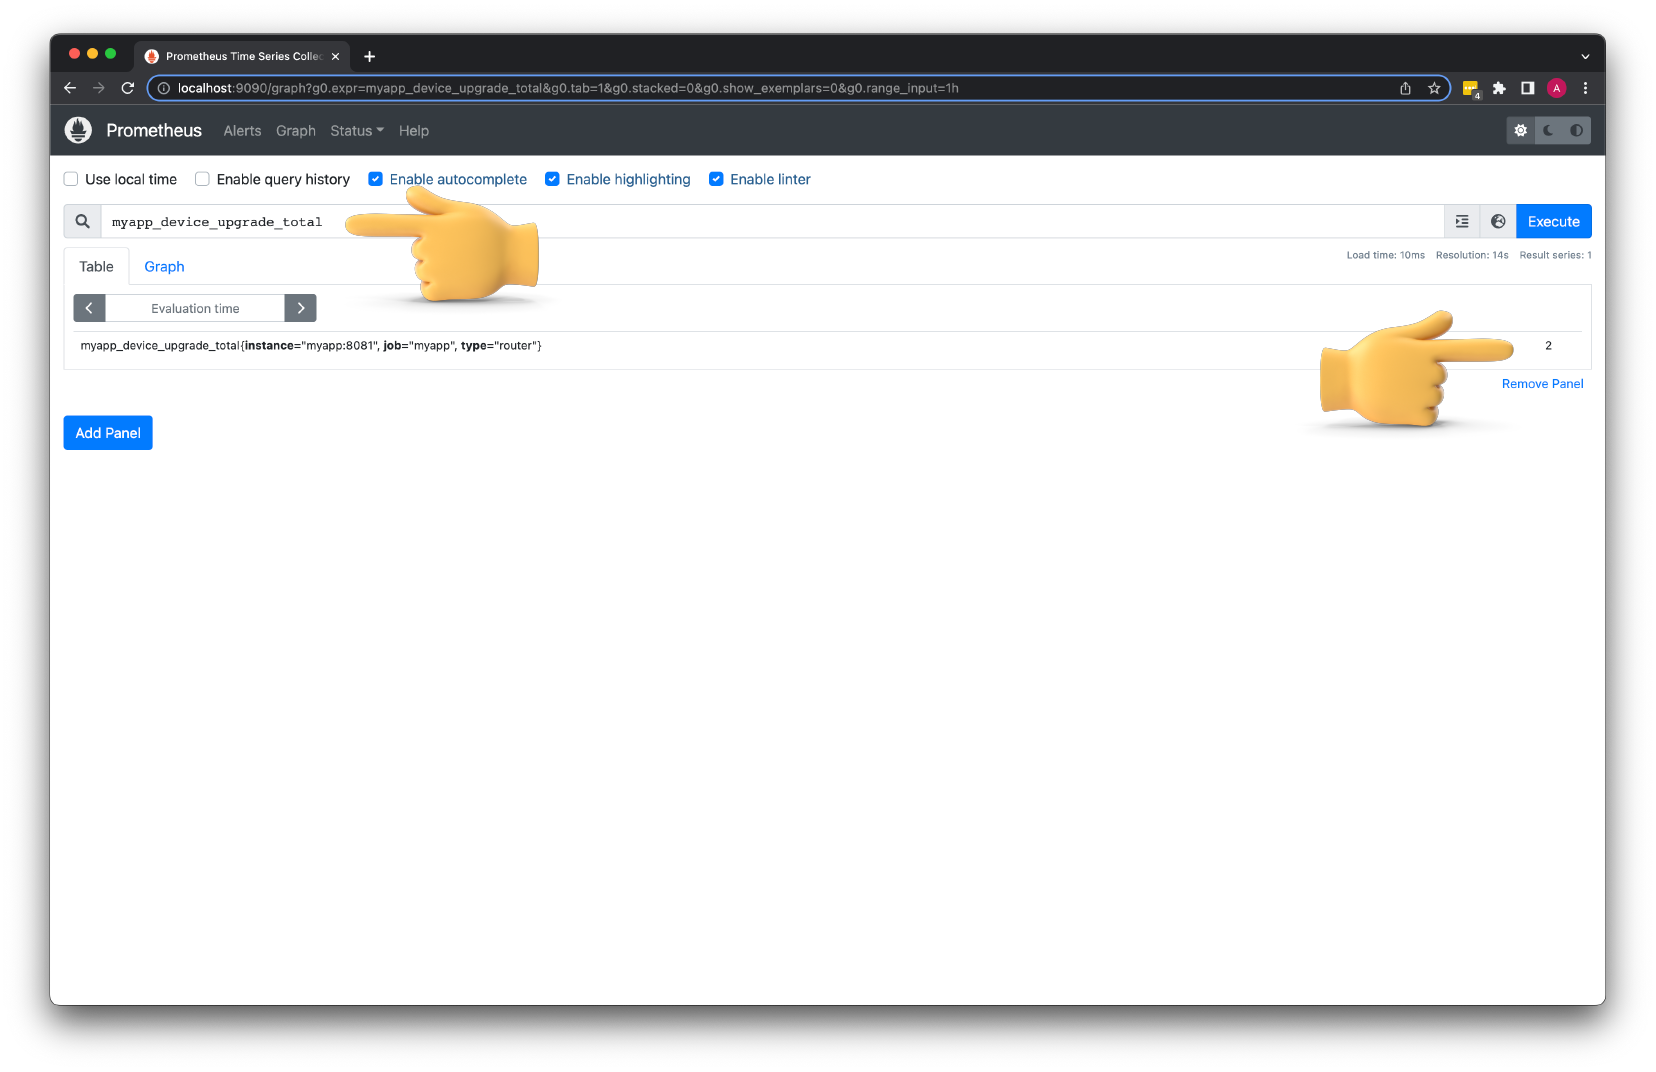
Just a total number of upgrades maybe not very useful. More interesting would be to measure the load. We can apply the rate() function to get the number of upgrades per second.
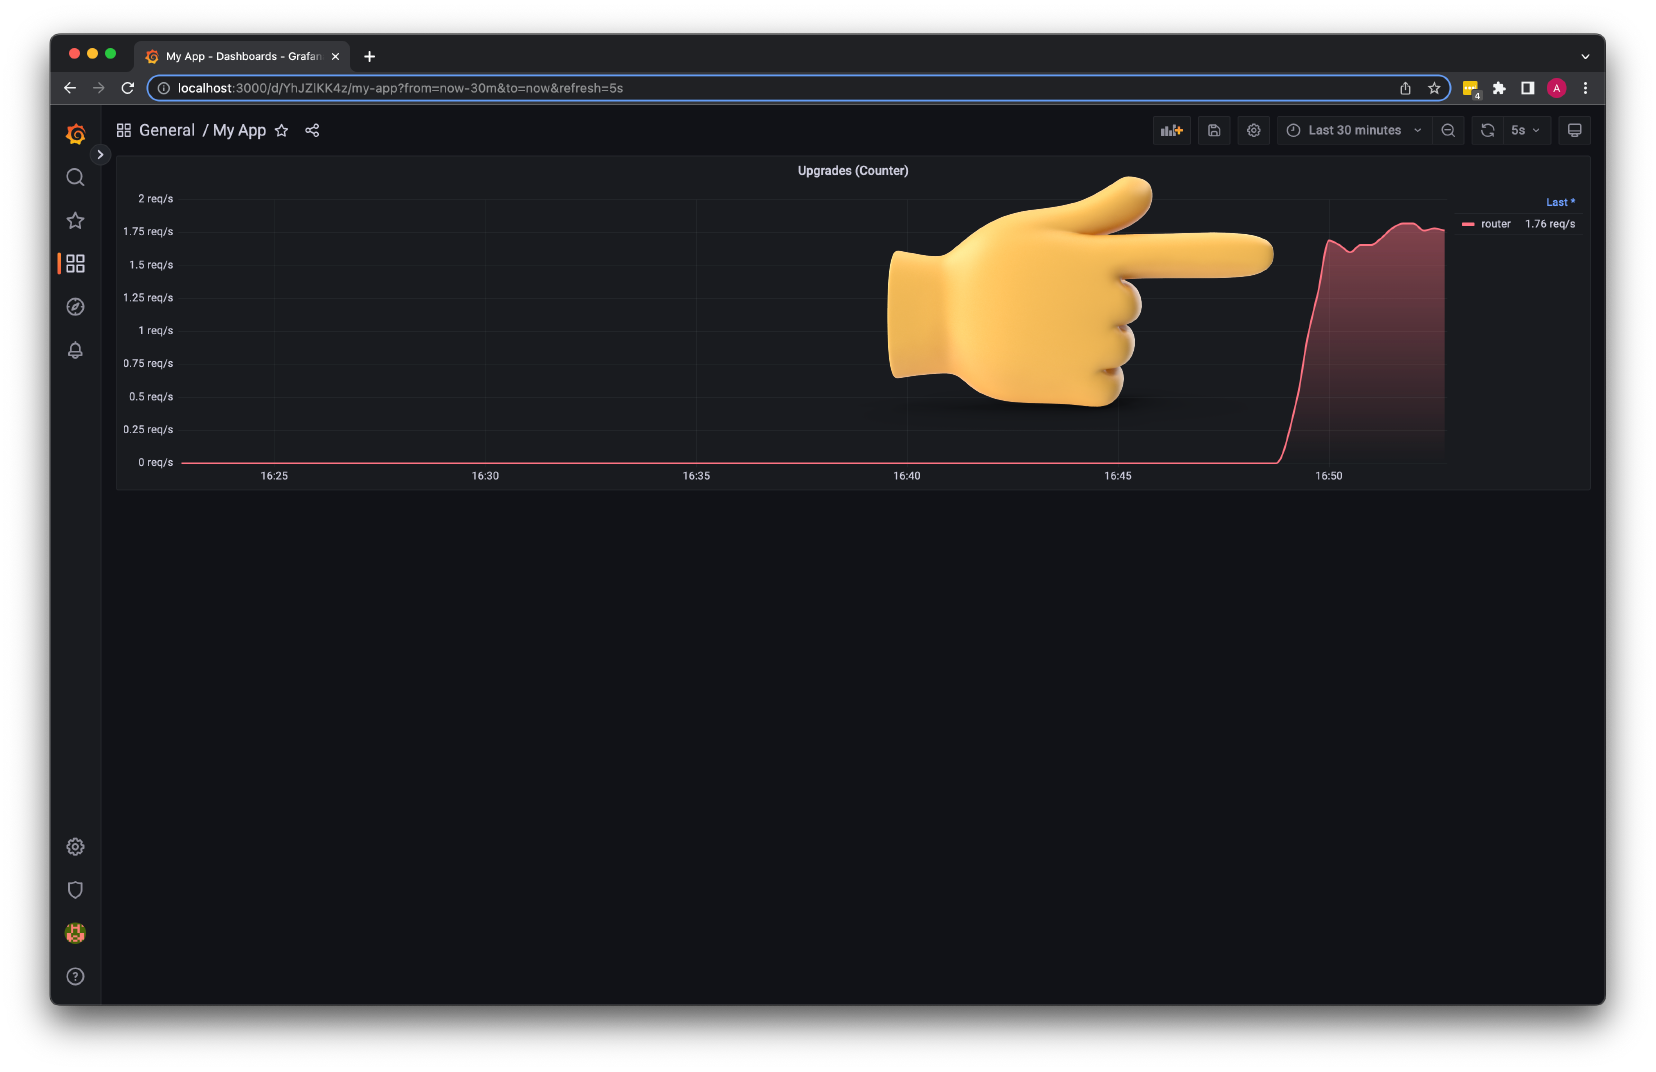
- Let's create a new Grafana chart and call it
Upgrades (Counter). - Use
rate(myapp_device_upgrade_total[1m])query. In this expression, we measure the rate of the upgrades per second for the last1 minute. Keep in mind that the interval must be at least4times larger than the scrape interval. - For the legend, use
{{ type }}label. - Then pretty much the same customization as with the previous dashboard.
- For the
Unittype, userequests per second(rps). - Change the color to pink.
- Set the refresh rate to 5 or 10 seconds.
Before testing upgrades, let's introduce some artificial delay.
- Create a new sleep function.
- It will accept the maximum number of milliseconds and generate some random delay.
| my-app/main.go | |
|---|---|
Then include it in the upgradeDevice function.
Rebuild the app.
Now to generate some load, you can try to run curl multiple times, or you can use one of the open-source load testers such as hey.
Histogram
To measure latency or response sizes, we typically use Histogram. There is a significate benefit over summary that I'll show you in the following example.
Let's create a new metric and call it a duration of HistogramVec type.
| my-app/main.go | |
|---|---|
When naming histograms, you should follow Prometheus naming conventions and use one of the base units. When measuring time, instead of minutes or milliseconds, you should use seconds. Later you can convert it using either using simple math or a built-in Grafana type system.
The key and sometimes a challenge when working with histograms is that you must come up with some time buckets ahead of time. On the other hand, a summary does not require it, but there is an even bigger issue with it.
You can use some build functions to automatically generate buckets, or you can hardcode them. Here, for example, I want to declare five buckets, from 100 ms to 300 ms. They used to count requests. For example, if the request duration is less than 150 ms, the bucket count will go up.
Let's use one of the custom handlers to pass the metrics variable to the getDevices function.
- Add
metricsas an argument togetDevices. - Then get the current time.
- Use
sleepto simulate some latency. - Finally, record the observation using
Observefunction and the time elapsed sincenow.
Later, I'll show you how to measure duration by creating a custom middleware.
Rebuild the app.
Until you at least one invoke the /devices endpoint, the new histogram metric won't show up.
Before creating a dashboard, let's scrape the /metrics endpoint with curl.
We have all the buckets with the upper inclusive bound, including the sum and count.
..._duration_seconds_sumis the total sum of all observed values. Since I invoked the/devicesendpoint just once, it looks like the duration of that first request was around65ms....duration_seconds_count- is the count of events that have been observed. Since I made a single request, we have a single count.
...
# HELP myapp_request_duration_seconds Duration of the request.
# TYPE myapp_request_duration_seconds histogram
myapp_request_duration_seconds_bucket{method="GET",status="200",le="0.1"} 1
myapp_request_duration_seconds_bucket{method="GET",status="200",le="0.15"} 1
myapp_request_duration_seconds_bucket{method="GET",status="200",le="0.2"} 1
myapp_request_duration_seconds_bucket{method="GET",status="200",le="0.25"} 1
myapp_request_duration_seconds_bucket{method="GET",status="200",le="0.3"} 1
myapp_request_duration_seconds_bucket{method="GET",status="200",le="+Inf"} 1
myapp_request_duration_seconds_sum{method="GET",status="200"} 0.065365292
myapp_request_duration_seconds_count{method="GET",status="200"} 1
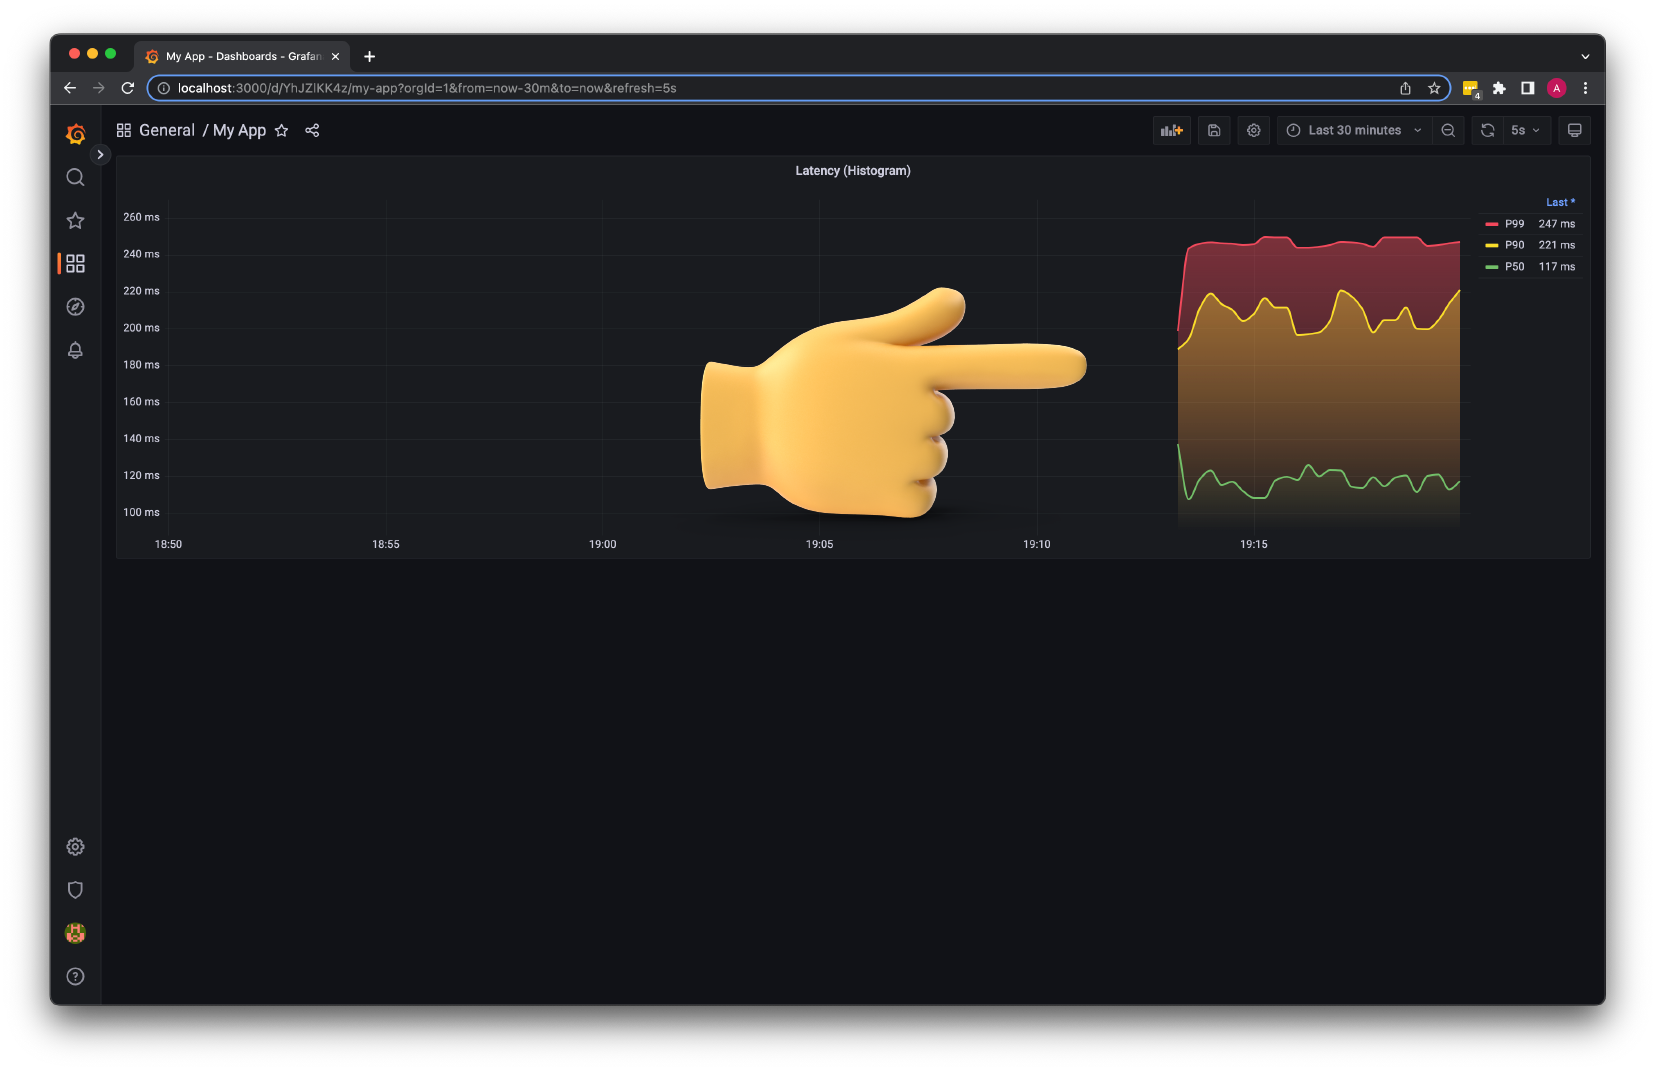
Now let's create a new Grafana chart for the request duration.
- Let's call it
Latency (Histogram). - For the query, let's calculate the multiple percentiles and start with
P99, which covers 99% of all requests that fall under that durationhistogram_quantile(0.99, rate(myapp_request_duration_seconds_bucket[1m])).
Here is the biggest difference, in my opinion, between histograms and summaries. You can easily aggregate histogram values across all the replicas of your service. Especially in the cloud, we usually run multiple replicas of the application, sometimes even hundreds of them. When using a summary, you can only calculate the percentile for each individual application. On the other hand, with a histogram, it's easy to aggregate across all the replicas.
Also, histograms cover almost or maybe even all use cases for summaries. As I said, the downside is that you need to provide interval buckets ahead of time.
Even if we have a single application right now, let's make this query future-proof and update the query to histogram_quantile(0.99, sum(rate(myapp_request_duration_seconds_bucket[1m])) by (le))
- For the legend, use
P99. - Let's also repeat the same process for
p90andp50. - Then make the same customizations for the graph.
- For the unit, use
seconds. - Optionally you can override some variables.
- Change the color for P99 to red.
- Then for P90, use yellow.
- Finally, for p90, you can use green color.
Now let's generate some load.
Summary
The last metric type is summary. It's a little bit more convenient than a histogram in way that you don't need to define buckets ahead of time. But it's not possible to aggregate across multiple replicas of your application. I almost never use it.
As with any other metric, you can declare it as a summary vector. But for simplicity, let's just use a summary.
| my-app/main.go | |
|---|---|
- Let's call it
login_request_duration_seconds. - When you declare the summary metric, you can specify percentiles instead of buckets. Here we have the same
p99,p90, andp50percentile, which is just amedian. - Also, don't forget to register it using
MustRegisterfunction.
For the summary, let's create a new login endpoint and a handler, but in this case, we'll use a middleware pattern.
First, let's create a similar custom http handler but without the metrics property.
The handler will only use the sleep function and return Welcome to the app! to the client.
| my-app/main.go | |
|---|---|
Now the middleware. It accepts the http handler and the metrics and returns another http handler. In this way, you can chain as many middleware functions as you want. For this use case, we only want to measure the duration of the request. Let's record time now and then use a similar Observe function right after the http handler.
| my-app/main.go | |
|---|---|
- In the
main()function, declareloginHandler. - Then use
middlewareto wrap it. - Finally, we can use it in the
/loginendpoint as a handler.
Rebuild the app.
Let's try to access the /login endpoint.
If you scrape the /metrics endpoint again, you'll see similar output as the histogram. But instead of buckets, you have the percentiles that were computed on the server side already.
...
# HELP myapp_login_request_duration_seconds Duration of the login request.
# TYPE myapp_login_request_duration_seconds summary
myapp_login_request_duration_seconds{quantile="0.5"} 0.073964833
myapp_login_request_duration_seconds{quantile="0.9"} 0.073964833
myapp_login_request_duration_seconds{quantile="0.99"} 0.073964833
myapp_login_request_duration_seconds_sum 0.073964833
myapp_login_request_duration_seconds_count 1
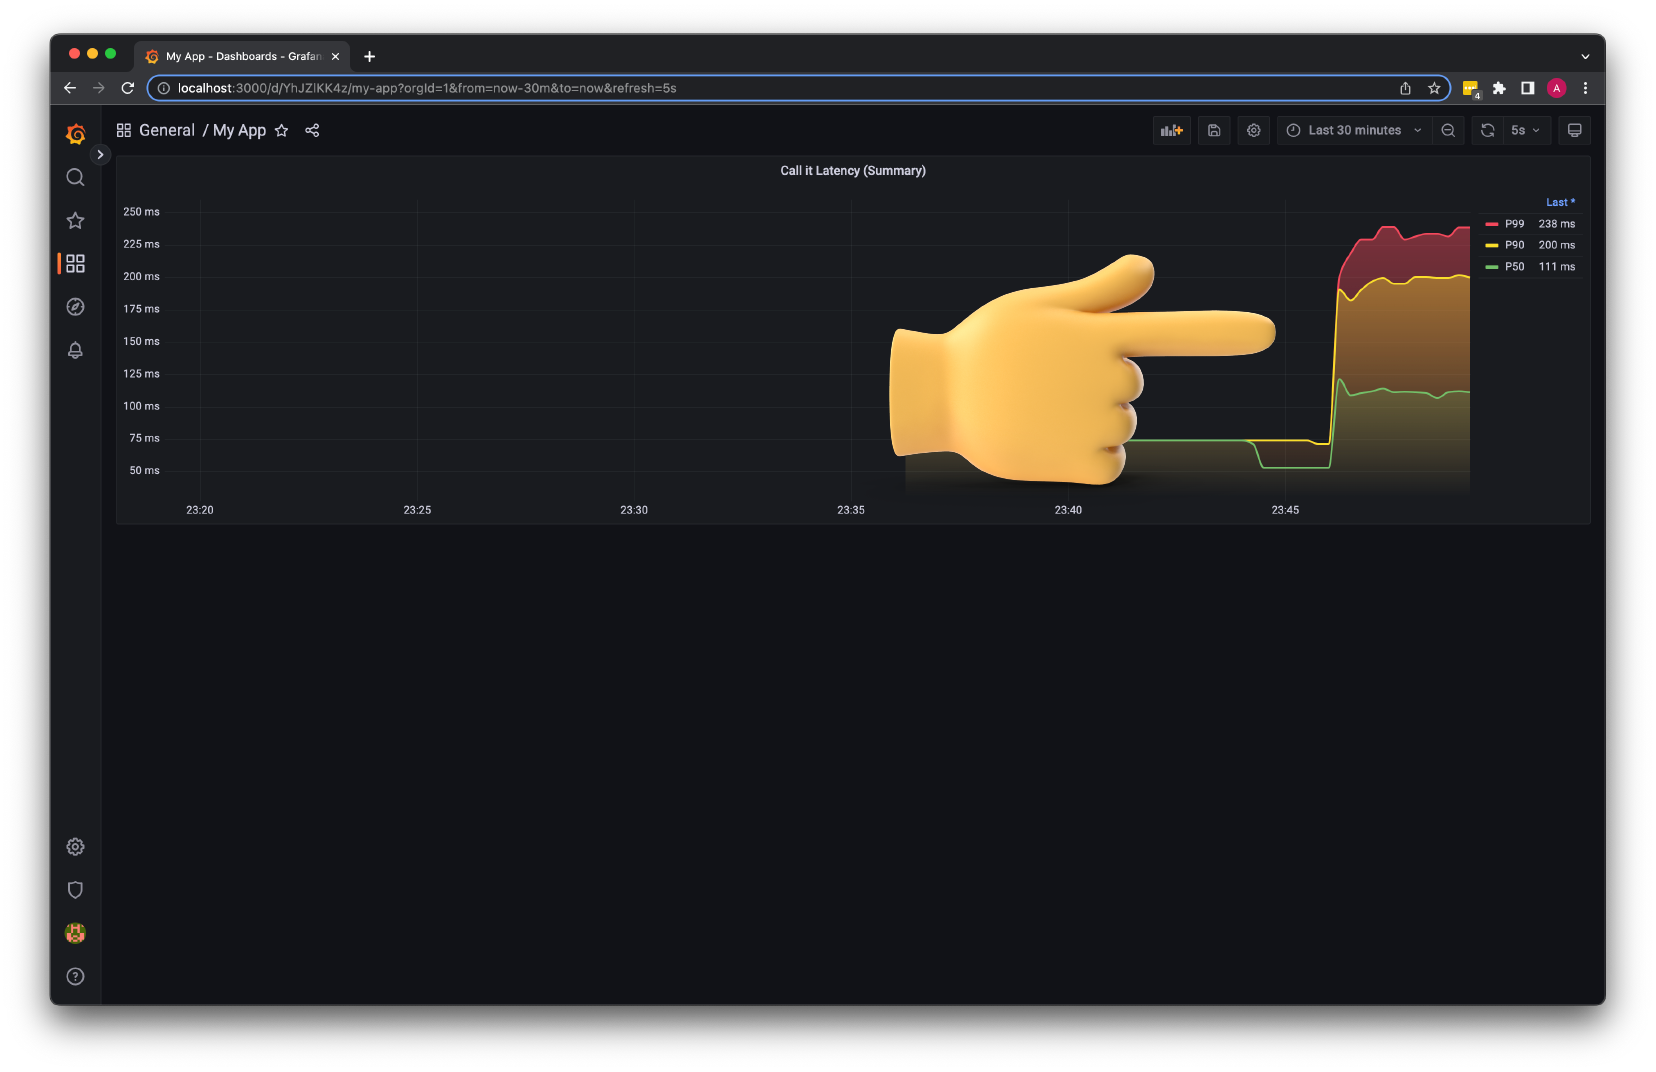
- Let's create the last graph for this tutorial. Call it
Latency (Summary). - For the query, use
myapp_login_request_duration_seconds{quantile="0.99"}metric with different values. The first isP99. - Then
P90andP50. - For the unit type, use
secondsas well. - Also, if you want, you can override some variables to match the histogram graph.
For the final test, let's generate some load.